# Welcome to Alpha

Information for those participating in the Alpha trial

Thank you for joining us in testing our first product, Models.

We're hoping to use the Alpha rollout to get quality feedback on features, bugs, usability and, in general, your thoughts about the product.

To get you started, here are a few useful steps:

1. See our [**installation and setup**](/alpha-testing/installation-and-setup) guide if you haven't already installed Models.
2. Read about how to send [**error reports**](/alpha-testing/support-and-help#error-reports) (yep, there might still be some bugs), and how to get [**support**](/alpha-testing/support-and-help#support) from the team
3. Check out our extensive documentation, beginning with the [**Start Here**](/start-here/what-is-models) section

## Feedback

All feedback and comments are welcome and highly valued, so please feel free to email us at [**alpha@taglo.io**](mailto:alpha@taglo.io) to start a conversation.

For error reports and help solving specific issues, please raise a support ticket as explained [**here**](/alpha-testing/support-and-help).


# Installation and Setup

How to get Models up and running

## Downloading Models

You'll receive a link to download Models in the email that you received when you signed up for the Alpha Trial.

{% hint style="info" %}
If you do not have the download link, contact us at [**alpha@taglo.io**](mailto:alpha@taglo.io)
{% endhint %}

Follow your browser's instructions to open the download link.

## Installation

{% hint style="warning" %}
Models is currently a Windows-only application
{% endhint %}

Once you have clicked on the download link, you will be presented with an installation screen, as shown in the screenshot below.

<figure><img src="https://2847533834-files.gitbook.io/~/files/v0/b/gitbook-x-prod.appspot.com/o/spaces%2FVy65sax6FVoNo2UTlJ0x%2Fuploads%2FKDqCg092VG62UTg8AdFZ%2Fimage.png?alt=media&amp;token=679fd568-36d3-4db5-a75b-d7c3913d68e6" alt="A screenshot of a dialog asking users whether they want to install the Models application" width="425"><figcaption><p>Models Installation Screen</p></figcaption></figure>

Simply click **Install** to run the process. You will then see a screen as below - on completion, Models will be installed to your computer.

<figure><img src="https://2847533834-files.gitbook.io/~/files/v0/b/gitbook-x-prod.appspot.com/o/spaces%2FVy65sax6FVoNo2UTlJ0x%2Fuploads%2FacAsgURYDEV11HW27fxp%2Fimage.png?alt=media&amp;token=8ff0c15e-3a80-486f-b91a-a58eedcc2e99" alt="A screenshot of the Models in-progress installation window" width="485"><figcaption><p>Models Installation in Progress screen</p></figcaption></figure>

## Setup

When you install Models for the first time, a data storage folder will be created in *\[CurrentUser]/AppData/Roaming/Taglo*.

We recommend that you continue to use this folder for storage, though you can change storage folder at any time - see [**here**](/using-taglo-software/data-storage) for more information.

## Updates/Pinning to taskbar

Models will automatically check for and install updates each time it runs.

{% hint style="warning" %}
As Models is currently Alpha software, we cannot support out of date versions of the application, so ensuring that your software is up to date is critical.
{% endhint %}

If you want to pin Models to the Windows taskbar, you should only do so from the Windows start menu, as shown in the image below. If you pin Models to the taskbar from a running instance of the app, you won't receive automatic updates and you will see a warning each time you run the software.

<figure><img src="https://2847533834-files.gitbook.io/~/files/v0/b/gitbook-x-prod.appspot.com/o/spaces%2FVy65sax6FVoNo2UTlJ0x%2Fuploads%2Fc8xyPxt1Zs4ZTWj6X2SW%2Fimage.png?alt=media&amp;token=08e3dada-8399-486c-8baa-f2f4a2899339" alt="Screenshot showing the Windows start menu, with &#x22;Models&#x22; searched for. The Models app is display with a list of options, including &#x22;Pin to taskbar&#x22;"><figcaption><p>Pinning Models to the taskbar</p></figcaption></figure>


# Support and Help

How to send error reports and get help with Models

## Support

You can email [**support@taglo.io**](mailto:support@taglo.io) to create a support ticket, and we will get back to you as soon as we can.

If you are reporting a bug, please include as much relevant information as you can.

## Error reports

If you encounter a crash while using Models, an email should automatically be created for you containing diagnostic information relating to the crash, as in the screenshot below.

Simply send this email to [**support@taglo.io**](mailto:support@taglo.io) to create a ticket.

<figure><img src="https://2847533834-files.gitbook.io/~/files/v0/b/gitbook-x-prod.appspot.com/o/spaces%2FVy65sax6FVoNo2UTlJ0x%2Fuploads%2F0lqrX39y8T7tjs6bB13T%2Fimage.png?alt=media&amp;token=c8248eb0-590e-4566-ae97-58d63d6481e2" alt="An Outlook email creation dialog, showing a support email that has been automatically created by Models in response to an error. The email contains a code trace from the software with details of the error."><figcaption><p>Error report email from Models</p></figcaption></figure>


# Terms and Licence

How you can use our software

## Disclaimer

{% hint style="warning" %}
Except as expressly set forth in this agreement, to the maximum extent permitted by applicable law (a) Models ("the product") and any third-party products are provided and distributed on an “as-is” and “as-available” basis without warranties of any kind whatsoever, (b) Taglo and its suppliers do not make any other warranty of any kind, whether express, implied, statutory, or otherwise, and specifically disclaim any and all other warranties, including without limitation (i) the implied warranties of merchantability, fitness for a particular purpose, non-infringement, satisfactory quality and quiet enjoyment, and (ii) warranties arising out of any course of dealing or usage of trade, (c) Taglo and its suppliers are not responsible or liable for the deletion of or failure to store any content, data and other communications maintained or transmitted through use of the product, and (d) Taglo and its suppliers do not warrant that the products or third-party products will be uninterrupted, secure, error-free, or free of harmful components.
{% endhint %}

## Licence Agreement

### End-User License Agreement (EULA) of Models

This End-User License Agreement ("EULA") is a legal agreement between you and Taglo Ltd.

This EULA agreement governs your acquisition and use of our Models software ("Software") directly from Taglo Ltd or indirectly through a Taglo Ltd authorized reseller or distributor (a "Reseller").

Please read this EULA agreement carefully before completing the installation process and using the Models software. It provides a license to use the Models software and contains warranty information and liability disclaimers.

If you register for a free trial of the Models software, this EULA agreement will also govern that trial. By clicking "accept" or installing and/or using the Models software, you are confirming your acceptance of the Software and agreeing to become bound by the terms of this EULA agreement.

If you are entering into this EULA agreement on behalf of a company or other legal entity, you represent that you have the authority to bind such entity and its affiliates to these terms and conditions. If you do not have such authority or if you do not agree with the terms and conditions of this EULA agreement, do not install or use the Software, and you must not accept this EULA agreement.

This EULA agreement shall apply only to the Software supplied by Taglo Ltd herewith regardless of whether other software is referred to or described herein. The terms also apply to any Taglo Ltd updates, supplements, Internet-based services, and support services for the Software, unless other terms accompany those items on delivery. If so, those terms apply.

#### License Grant

Taglo Ltd hereby grants you a personal, non-transferable, non-exclusive licence to use the Models software on your devices in accordance with the terms of this EULA agreement.

You are permitted to load the Models software (for example a PC, laptop, mobile or tablet) under your control. You are responsible for ensuring your device meets the minimum requirements of the Models software.

You are not permitted to:

* Edit, alter, modify, adapt, translate or otherwise change the whole or any part of the Software nor permit the whole or any part of the Software to be combined with or become incorporated in any other software, nor decompile, disassemble or reverse engineer the Software or attempt to do any such things
* Reproduce, copy, distribute, resell or otherwise use the Software for any commercial purpose
* Allow any third party to use the Software on behalf of or for the benefit of any third party
* Use the Software in any way which breaches any applicable local, national or international law
* Use the Software for any purpose that Taglo Ltd considers is a breach of this EULA agreement

#### Intellectual Property and Ownership

Taglo Ltd shall at all times retain ownership of the Software as originally downloaded by you and all subsequent downloads of the Software by you. The Software (and the copyright, and other intellectual property rights of whatever nature in the Software, including any modifications made thereto) are and shall remain the property of Taglo Ltd.

Taglo Ltd reserves the right to grant licences to use the Software to third parties.

#### Termination

This EULA agreement is effective from the date you first use the Software and shall continue until terminated. You may terminate it at any time upon written notice to Taglo Ltd.

It will also terminate immediately if you fail to comply with any term of this EULA agreement. Upon such termination, the licenses granted by this EULA agreement will immediately terminate and you agree to stop all access and use of the Software. The provisions that by their nature continue and survive will survive any termination of this EULA agreement.

#### Governing Law

This EULA agreement, and any dispute arising out of or in connection with this EULA agreement, shall be governed by and construed in accordance with the laws of the United Kingdom of Great Britain and Northern Ireland.


# What is Models?

A beginner's overview of the Models app

**Models** is an app designed for working with timeseries-based calculations.

It's an incredibly powerful tool, and can be used in countless situations, but typically we use it for tasks such as:

* Creating financial forecasts and budgets
* Building business plans
* Modelling market trends

Models works as a standalone application, in which you can create your models, and view and flex outputs through compelling dashboards, but it will also generate fully-working, formatted Excel spreadsheets that you can share with colleagues and clients.


# Quick start

Things to do before you dive into  Models

1. Watch our [**2 minute Models overview video**](/start-here/tutorials#id-2-minute-models-overview), so that you quickly get an idea of what can be done in Models.
2. Read about [**The Taglo Interface**](/using-taglo-software/the-taglo-interface).  It will save you a lot of time down the road.
3. Watch our [**Introduction to Models tutorial**](/start-here/tutorials#introduction-to-models-by-taglo).  We walk through:
   * Creating a Model
   * Generating a revenue forecast
   * Applying multiple Dimensions
   * Visualising your Model in a Dashboard
   * Setting up a Layout and generating Excel

Have fun!


# Tutorials

We have created a range of video tutorials to help you get started

{% hint style="info" %}
We will be adding tutorials throughout the Alpha trial rollout. If you are subscribed to our newsletter, you will receive notifications when a new tutorial is added.
{% endhint %}

Find all of our tutorials on [**our YouTube channel**](https://www.youtube.com/@tagloltd/featured) at any time.

## 2-minute Models overview

{% embed url="<https://www.youtube.com/watch?v=y5vLX6hy63s>" %}
Quick overview of Models features
{% endembed %}

## Introductory tutorials

### Introduction to Models by Taglo

{% embed url="<https://www.youtube.com/watch?v=RjMn8vOSlTk>" %}
30 minute introductory tutorial
{% endembed %}


# The Taglo Interface

How to navigate and complete tasks in Taglo software

Taglo software is designed to perform both simple and complex tasks, while handling both small and large amounts of data.&#x20;

Our UI is designed to:

1. Cope with any scenario you might throw at it (within reason!)
2. Allow you to stay within your current train of thought at all times without having to constantly switch between interfaces to complete related tasks.

You can find lots of real-life examples of how the UI works in our [**Tutorials**](/start-here/tutorials) section.

The rest of this section goes through the key things you need to know to become a Taglo UI expert.


# Navigating in Models

How to navigate between different functions in Models

## Models tabs

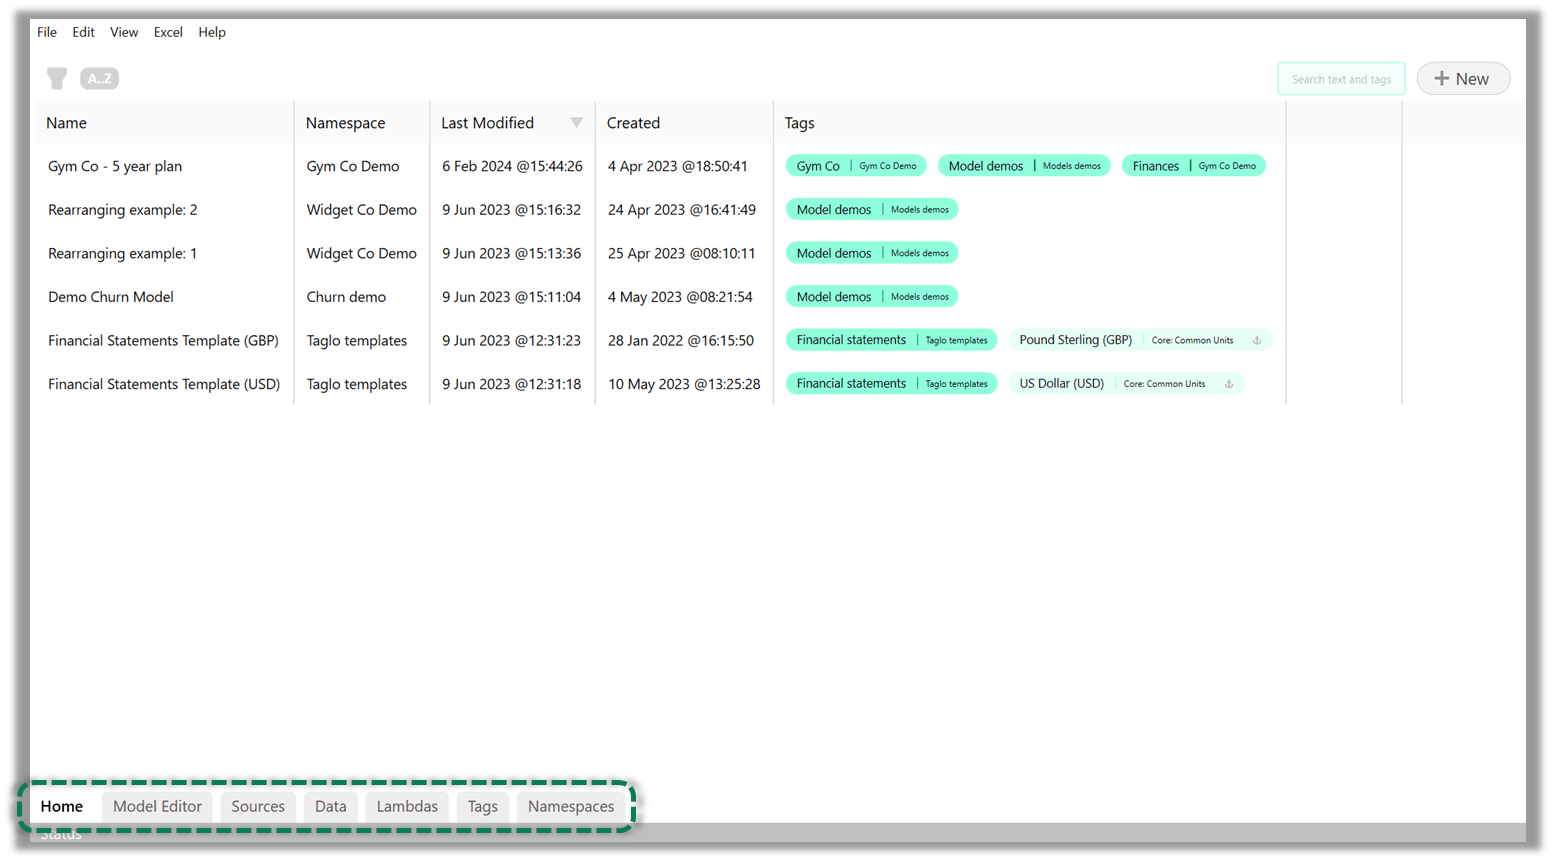
Models is structured as a number of "applets" sitting inside the main Models application. You can navigate between these applets by using the navigation bar which is always visible at the bottom of the application.

Any Models that you open for editing can be found in the [**Model Editor**](/models/model-editor) tab, which is where you will spend most of your time.

<figure><img src="https://2847533834-files.gitbook.io/~/files/v0/b/gitbook-x-prod.appspot.com/o/spaces%2FVy65sax6FVoNo2UTlJ0x%2Fuploads%2FHUK13YjIziu9acefKs4o%2Fimage.png?alt=media&amp;token=b8e16893-c8d0-4125-8fbb-bf56a0c0101b" alt="Screenshot showing the Home tab of Models. The navigation bar, at the bottom of the application, is highlighted."><figcaption><p>The Models Home tab</p></figcaption></figure>


# List Views

How we display lists of things that you create

## Overview

In Taglo software, you'll be spending much of your time creating and editing items that belong in lists. Examples of these from Models are:

* A list of [**Variables**](/variables/variable-basics)
* A list of [**Assumptions**](/assumptions/introduction-to-assumptions)
* A list of [**Sheets**](/layout/sheets) in your [**Layout**](/layout/generating-excel)
* A list of [**Calculation Parts**](/calculations/calculation-parts) in a [**Calculation**](/calculations/introduction-to-calculations)

Given that you'll be spending so much time working in lists, we provide a consistent way of viewing, searching, and managing the items in these lists.

## View types

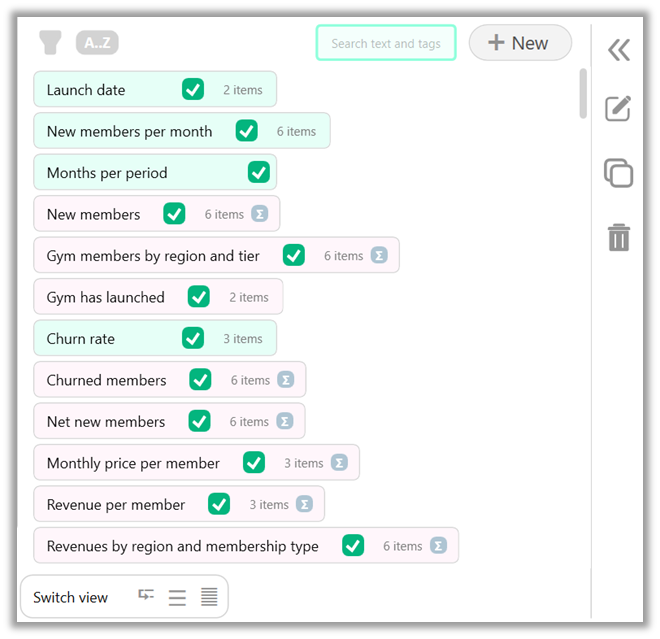
The default type of view for a list of items will vary with the item. There are 2 main views that you will usually see, Basic and Tree. You may sometimes also see a Grid view.

<table data-view="cards"><thead><tr><th></th><th></th></tr></thead><tbody><tr><td><strong>Basic</strong></td><td><img src="https://2847533834-files.gitbook.io/~/files/v0/b/gitbook-x-prod.appspot.com/o/spaces%2FVy65sax6FVoNo2UTlJ0x%2Fuploads%2FlaCpmhLiqQidDUC7sPc7%2Fimage.png?alt=media&amp;token=8bd60b27-2e9b-41f4-a893-e499a482e8bb" alt="" data-size="original"></td></tr><tr><td><strong>Tree</strong></td><td><img src="https://2847533834-files.gitbook.io/~/files/v0/b/gitbook-x-prod.appspot.com/o/spaces%2FVy65sax6FVoNo2UTlJ0x%2Fuploads%2FBdd7faEykQl68JUsedaB%2Fimage.png?alt=media&amp;token=eafbede9-1bbd-411f-9ac8-177abe2b14ce" alt="" data-size="original"></td></tr><tr><td><strong>Grid</strong></td><td><img src="https://2847533834-files.gitbook.io/~/files/v0/b/gitbook-x-prod.appspot.com/o/spaces%2FVy65sax6FVoNo2UTlJ0x%2Fuploads%2FVYZpoIyUN5kF10F938XJ%2Fimage.png?alt=media&amp;token=a8c0ce8a-3484-423d-b005-0d1a61651e94" alt="" data-size="original"></td></tr></tbody></table>

## Switching views

Taglo allows you to view most lists in multiple ways. For instance, you may want to view an item that is presented in a Tree View as a Basic List, or in a Grid View.

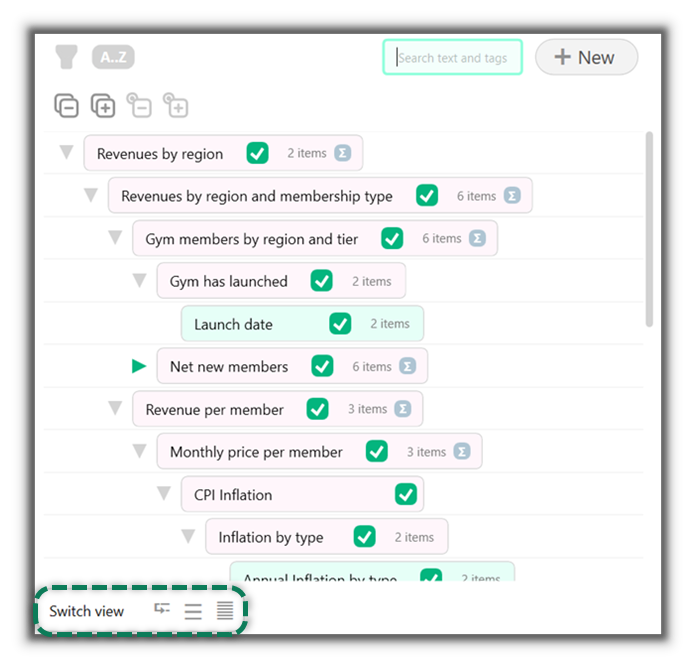
You'll find the Switch View control (shown below) at the bottom of all lists that have multiple views enabled. Simply click on one of the buttons to select a view.

<figure><img src="https://2847533834-files.gitbook.io/~/files/v0/b/gitbook-x-prod.appspot.com/o/spaces%2FVy65sax6FVoNo2UTlJ0x%2Fuploads%2FPFyoY0YTyNHZysTPM9qK%2Fimage.png?alt=media&amp;token=0a95ffc6-d3c7-42e6-8aba-bece6099c761" alt="A list of Variables, shown in a Tree View, with the Switch View control highlighted." width="522"><figcaption><p>The Switch View control</p></figcaption></figure>

{% hint style="info" %}
If you are currently working in a list, you can also switch between views with the keyboard shortcut **`Ctrl+Number`***<mark style="background-color:yellow;">.</mark>*

e.g. To switch to the second available view, press **`Ctrl+2`**
{% endhint %}


# Adding Items

How to add new items to a list

Most lists allow you to add new items at any time. There are 3 ways to add an item to the list:

## 1. New item button

If adding items is enabled, you will always see a<img src="https://2847533834-files.gitbook.io/~/files/v0/b/gitbook-x-prod.appspot.com/o/spaces%2FVy65sax6FVoNo2UTlJ0x%2Fuploads%2FtSALnszwIQIYG22Egw0M%2Fimage.png?alt=media&amp;token=d8c86ab6-7790-4e53-8ece-24ae53204ea4" alt="Screenshot of the &#x22;New item&#x22; button" data-size="line">button in the top right of the list.

Click this button to bring up an "Add new item" dialog.

## 2. Keyboard shortcut

If you currently have an item in a list selected, or your cursor is in one of the Search boxes of a list, you will be able to bring up the "Add new item" dialog by pressing `Ctrl+N`.

## 3. From an empty list

If a list is empty, or your Search has returned no results, you will see a prompt similar to the one below. Click on this button to bring up the "Add new item" dialog.

<figure><img src="https://2847533834-files.gitbook.io/~/files/v0/b/gitbook-x-prod.appspot.com/o/spaces%2FVy65sax6FVoNo2UTlJ0x%2Fuploads%2Fh4LMY5BBvzEDX6WzR1ch%2Fimage.png?alt=media&amp;token=337da82a-74f7-4724-8024-f38948ce177b" alt="A screenshot of the prompt shown when no search results are returned" width="317"><figcaption><p>The empty list prompt</p></figcaption></figure>


# Deleting Items

How to delete items

## Overview

Most items in Models can be deleted. If deletion is available, you will be able to delete an item by selecting it in the list, and pressing the `DEL` key, or by using the [**Delete button in the item Preview**](/using-taglo-software/the-taglo-interface/previewing-and-editing#preview-actions).

## Preventing deletion of referenced items

Taglo automatically stops you from deleting items that are referenced elsewhere in your work.

If you try to delete an item that is referenced elsewhere, you will see a screen like the below. This view shows you where the item (in this case a [**Tag**](/tags/introduction-to-tags)) is referenced, so that you can decide whether to remove those references and delete the item, or to keep the item.

{% hint style="info" %}
Note, for some items within a Model, such as a [**Variable**](/variables/variable-basics) or [**Assumption**](/assumptions/introduction-to-assumptions), you can delete the items without seeing the warning screen, even if it is referenced. In this case, Models will automatically remove references so that your Model does not break. You can always [**undo**](/using-taglo-software/the-taglo-interface/save-undo-redo) a deletion if you did not mean to do remove the item.
{% endhint %}

<figure><img src="https://2847533834-files.gitbook.io/~/files/v0/b/gitbook-x-prod.appspot.com/o/spaces%2FVy65sax6FVoNo2UTlJ0x%2Fuploads%2FR2QmPRt4JuiVC0GrFWSC%2Fimage.png?alt=media&amp;token=afb532b9-f326-48a8-964d-d78a487b7eca" alt="Screenshot showing the Deletion warning popup"><figcaption><p>Deletion warning screen</p></figcaption></figure>


# Searching and Filtering

How to find things in lists

Your lists might get big, so we provide several ways to sort and find your items.

1. [**Searching with Tags**](#searching-with-tags)
2. [**Searching with Text**](#searching-with-text)
3. [**Filtering**](#filtering)
4. [**Sorting**](#sorting)

Read on to understand each of these.

## Searching with Tags

{% hint style="info" %}
Tags are central to how Taglo products work - for more information about Tags, look at the [**dedicated Tags section**](/tags/introduction-to-tags) of this documentation.
{% endhint %}

Many of the items that will be presented to you in list form will either be tagged directly or related to Tags in some other way.

To filter by Tags, just type in the Tag search box and select all Tags that you want to include in your search. You will be presented with all results that are directly tagged with the selected Tags, or are tagged with descendants of the selected Tags.

> For instance, if you have an item that is tagged with `Spain`, it will appear in results for the Tag `Spain`, but it will also appear in results for the Tag `Europe`, because `Europe` is a parent of `Spain`.

<figure><img src="https://2847533834-files.gitbook.io/~/files/v0/b/gitbook-x-prod.appspot.com/o/spaces%2FVy65sax6FVoNo2UTlJ0x%2Fuploads%2Fa4N24BtoAdxcu9pJH3Bq%2FTag%20search.gif?alt=media&amp;token=3d22979d-d8c6-4f43-a504-7be8327d5f0e" alt="GIF showing a list of Variables being filtered by Tags. The user first selects the &#x22;Region&#x22; tag, and then the &#x22;GBP&#x22; tag. Each time a tag is selected, the list is refined to show only relevant items." width="488"><figcaption><p>Filtering a list using Tags</p></figcaption></figure>

## Searching with Text

To search by text, just type in the search box. To search for multiple terms, select the search item from the dropdown list to "lock-in" the search term, as shown in the GIF below. You can add as many search terms as you want, and clear them at any point using the Clear <img src="https://2847533834-files.gitbook.io/~/files/v0/b/gitbook-x-prod.appspot.com/o/spaces%2FVy65sax6FVoNo2UTlJ0x%2Fuploads%2FBYNQmOFL7syDSI44pz4M%2Fimage.png?alt=media&amp;token=f430cccf-f6b6-48a2-9f7a-c0b2e4d47776" alt="" data-size="line"> button.

{% hint style="info" %}
Use the **`Up`** and **`Down`** arrow keys to move between the search box and items in the list
{% endhint %}

<figure><img src="https://2847533834-files.gitbook.io/~/files/v0/b/gitbook-x-prod.appspot.com/o/spaces%2FVy65sax6FVoNo2UTlJ0x%2Fuploads%2FvE7Hto7s7h4jaeaUcGlQ%2FText%20search.gif?alt=media&amp;token=cf58f93b-1265-41ef-ab19-578d61eb9301" alt="GIF showing a list of Variables being filtered using text search. The user enters the word &#x22;Revenues&#x22; into the search box, and selects the search item from the drop down, which filters the list to only Variables containing the word &#x22;Revenue&#x22;. The user then types in the search box again, with the word &#x22;region&#x22;. This further filters the list." width="488"><figcaption><p>Filtering a list using Text Search</p></figcaption></figure>

## Filtering by Properties

Most lists allow you to filter items by a property of the item. To use, simply click on the filter<img src="https://2847533834-files.gitbook.io/~/files/v0/b/gitbook-x-prod.appspot.com/o/spaces%2FVy65sax6FVoNo2UTlJ0x%2Fuploads%2FZ9Ne6Hi7DHylInKU6Rbb%2Fimage.png?alt=media&amp;token=8e3223ce-c995-467e-8d64-2b94de99e694" alt="" data-size="line"> icon, select the property you wish to filter by, and the desired value of the property.

The example below shows the user filtering for Variables that have not yet been added to the [**Layout**](/layout/generating-excel).

<figure><img src="https://2847533834-files.gitbook.io/~/files/v0/b/gitbook-x-prod.appspot.com/o/spaces%2FVy65sax6FVoNo2UTlJ0x%2Fuploads%2F5s1R8Wfkt6P2kEr6XxED%2FProperty%20filter.gif?alt=media&amp;token=d4c4114c-f0ff-4eac-b6fd-0c1088c61bd5" alt="GIF showing a list of Variables being filtered by properties. The user presses the Filter icon, which brings up a list of properties. They choose the &#x22;Is in Layout&#x22; property, and then the value &#x22;False&#x22;. This filters the list to only Variables that are not yet in the Layout." width="488"><figcaption><p>Filtering a list using Properties</p></figcaption></figure>

## Sorting by Properties&#x20;

Most lists allow you to sort items by a property of the item. To use, simply click on the sort <img src="https://2847533834-files.gitbook.io/~/files/v0/b/gitbook-x-prod.appspot.com/o/spaces%2FVy65sax6FVoNo2UTlJ0x%2Fuploads%2FsyXxev3siSyMVjGiKcpT%2Fimage.png?alt=media&amp;token=822901fa-b924-49b4-bb52-7895e26e1b53" alt="" data-size="line">icon, select the property you wish to sort by, and select the sort order (ascending/descending). You can select multiple properties to sort by, and rearrange them by dragging and dropping.

<figure><img src="https://2847533834-files.gitbook.io/~/files/v0/b/gitbook-x-prod.appspot.com/o/spaces%2FVy65sax6FVoNo2UTlJ0x%2Fuploads%2FWROy0yr1gLIxrn9sOBQG%2FProperty%20sorter.gif?alt=media&amp;token=528c92d8-3dba-429c-9241-e4b28b9ad847" alt="GIF showing a list of Variables being sorted by property. The user presses the sort (A to Z) button, which brings up a list of properties to sort by. They then select the &#x22;Name&#x22; property, followed by the &#x22;Unit&#x22; property. They then change the order of the sorters and the direction of the sort." width="488"><figcaption><p>Sorting a list using Properties</p></figcaption></figure>


# Previewing and Editing

How to view and edit information about items in lists

## Showing and Hiding Previews

Most lists in Taglo software follow the same approach to displaying information about their items.

Clicking on an item in the list (or anywhere next to the item) will bring up a **preview panel** on the right-hand side of the list.

{% hint style="info" %}
The only exception to this is when you are selecting an item from a list [**within a Dialog**](/using-taglo-software/the-taglo-interface/using-wizards#selecting-items-in-dialogs), in which case, clicking directly on the item will select the item - you will need to click next to the item to preview it.
{% endhint %}

Clicking on the close button (<img src="https://2847533834-files.gitbook.io/~/files/v0/b/gitbook-x-prod.appspot.com/o/spaces%2FVy65sax6FVoNo2UTlJ0x%2Fuploads%2FzEG1ml1SDkWD1CKS18fA%2Fimage.png?alt=media&amp;token=605d3d05-dcf6-4bcd-af56-ba18be61d967" alt="Screenshot of the &#x22;Collapse preview&#x22; button" data-size="line">) in the preview panel will collapse the preview to the right hand side of the list. To reopen the preview, press the open preview button (<img src="https://2847533834-files.gitbook.io/~/files/v0/b/gitbook-x-prod.appspot.com/o/spaces%2FVy65sax6FVoNo2UTlJ0x%2Fuploads%2FCJeWrC6KZztEl6iD8jvQ%2Fimage.png?alt=media&amp;token=765b8e34-9f66-49ad-8f32-2d864ccf2339" alt="Screenshot of the &#x22;Expand Preview&#x22; button" data-size="line">) in the collapsed preview.

<figure><img src="https://2847533834-files.gitbook.io/~/files/v0/b/gitbook-x-prod.appspot.com/o/spaces%2FVy65sax6FVoNo2UTlJ0x%2Fuploads%2FyjFpeeU1MaemHYxliHbE%2FPreview.gif?alt=media&amp;token=7a55039f-f728-483e-a011-dcbcb6096098" alt="GIF showing use of the Preview Panel in a list of Variables. The user selects several Variables in turn, which details of each Variable being shown in the Preview Panel, which appears on the right hand side of the interface. The user then closes the preview panel and reopens it."><figcaption><p>Showing and collapsing the Preview Panel</p></figcaption></figure>

## Preview Actions

You will also usually see a standard set of buttons at the top of the preview <img src="https://2847533834-files.gitbook.io/~/files/v0/b/gitbook-x-prod.appspot.com/o/spaces%2FVy65sax6FVoNo2UTlJ0x%2Fuploads%2Fii0umh9rghwt9I7Jkv9t%2Fimage.png?alt=media&amp;token=3f5afe56-4459-43c1-a259-070bc2dacf76" alt="Screenshot of the Edit, Copy and Delete buttons" data-size="line">  that will allow you to perform common actions:

1. **Edit** the item - clicking here will open an Edit [**Wizard** ](/using-taglo-software/the-taglo-interface/using-wizards)\[or use `Ctrl+E` keyboard shortcut]
2. **Copy** the item - clicking here will create a duplicate item \[or use `Ctrl+D` keyboard shortcut]
3. **Delete** the item - \[or press `Del` key with one or more items selected in the list]&#x20;

Edit, Copy and Delete controls are also shown on the collapsed preview.

{% hint style="info" %}
In some lists, you may be able to edit multiple items simultaneously, and the preview panel will show a different view for single and multiple selections
{% endhint %}


# Using Wizards

How to use Taglo wizards

## Overview

Many actions in Taglo software are performed through a wizard-like dialog. We try to provide non-wizard shortcuts for the most common tasks, but you will still find yourself using wizards throughout your work.

Our philosophy behind these wizards is to provide a way for the user to enter complex and situation-dependent information, without creating barriers to the flow of the user's thought process.&#x20;

{% hint style="success" %}
In Taglo, you should (almost) never see a pop-up window that stops you performing your next task!
{% endhint %}

## Navigating Wizards

A Taglo wizard is simply a series of steps that need to be completed in order to perform an action or create/edit an item.

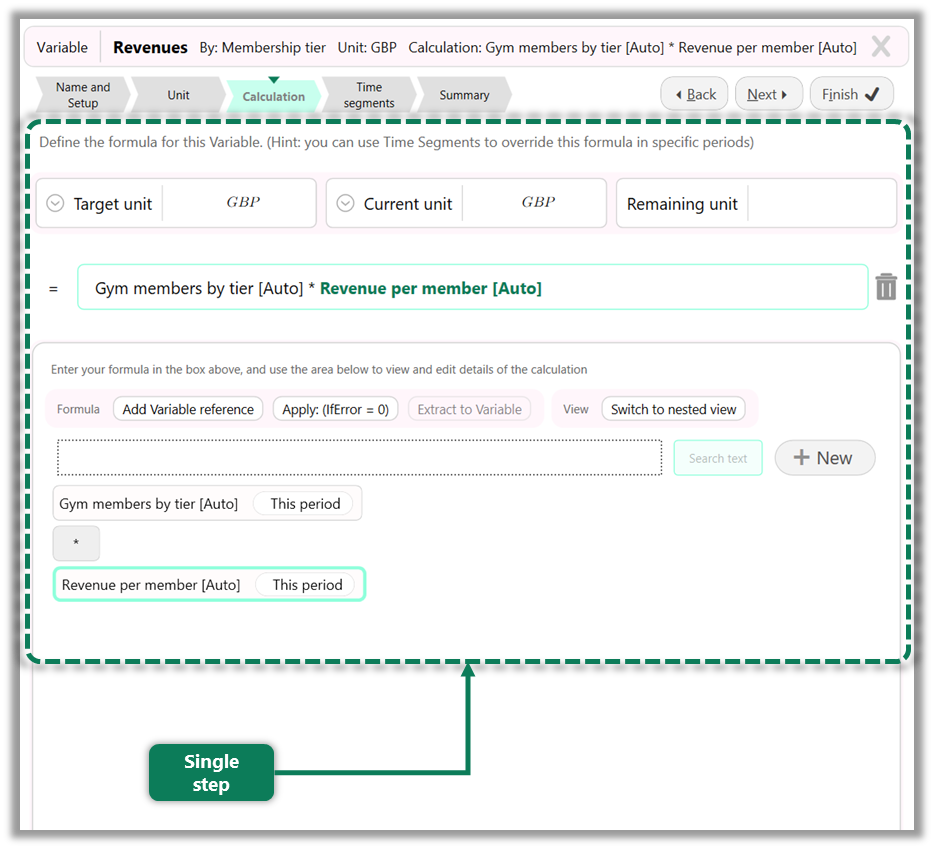
Depending on the complexity of each step, it may be presented in a vertical list on the same page with other steps, or on its own page of the wizard.

<table data-card-size="large" data-view="cards" data-full-width="false"><thead><tr><th></th><th></th><th></th></tr></thead><tbody><tr><td><strong>Wizard Page with Multiple Steps</strong></td><td><img src="https://2847533834-files.gitbook.io/~/files/v0/b/gitbook-x-prod.appspot.com/o/spaces%2FVy65sax6FVoNo2UTlJ0x%2Fuploads%2FXU7wKkqFzsFH478XHsO2%2Fimage.png?alt=media&amp;token=9372fee0-a52d-4429-9bd4-a24d58014073" alt="" data-size="original"></td><td></td></tr><tr><td><strong>Wizard Page with Single Step</strong></td><td><img src="https://2847533834-files.gitbook.io/~/files/v0/b/gitbook-x-prod.appspot.com/o/spaces%2FVy65sax6FVoNo2UTlJ0x%2Fuploads%2FN4WxoxZM3lYxSfJUU3cR%2Fimage.png?alt=media&amp;token=04535c8e-3c45-4402-a643-9d57c7f4d76e" alt="" data-size="original"></td><td></td></tr></tbody></table>

Steps will be shown and hidden depending on options you select as you progress through the wizard. If any data you have entered is invalid, you will be unable to navigate to the next page of the wizard or finish the wizard.

You can always cancel changes you've made by clicking the Cancel <img src="https://2847533834-files.gitbook.io/~/files/v0/b/gitbook-x-prod.appspot.com/o/spaces%2FVy65sax6FVoNo2UTlJ0x%2Fuploads%2F78VPiTkuHTkReFEEfy2U%2Fimage.png?alt=media&amp;token=2f89ac9d-24c7-4294-9ae5-f7652b0ffafe" alt="Screenshot of the &#x22;Cancel wizard&#x22; button" data-size="line"> button at the top-right of the wizard.

{% hint style="info" %}
On a page with multiple steps, you can quickly access different steps by pressing `Ctrl+[Number key]` where `[Number key]` is the number of the step as it appears on the page. For example, to quickly jump to the third step on the page, you'd press `Ctrl+3`.

See [here](/using-taglo-software/the-taglo-interface/keyboard-shortcuts#dialog-shortcuts) for a full list of keyboard shortcuts that you can use in dialogs.
{% endhint %}

{% hint style="info" %}
If the **Finish** button is enabled at any point (as in the image below), you can successfully exit the dialog by clicking **Finish**, even if you haven't entered information into all steps.

<img src="https://2847533834-files.gitbook.io/~/files/v0/b/gitbook-x-prod.appspot.com/o/spaces%2FVy65sax6FVoNo2UTlJ0x%2Fuploads%2F6sxggvoUflDWwId93frA%2Fimage.png?alt=media&amp;token=d2e8df59-da14-430f-bef5-dd983e40e02e" alt="" data-size="line">
{% endhint %}

## Selecting Items in Wizards

You will often need to select from a list of items when in a wizard.&#x20;

> For instance, you may need to assign one or more tags to the item that you are creating/editing. In this case, you will be presented with a list of tags, using an adaptation of the familiar **List View** that was discussed [**earlier in this section**](/using-taglo-software/the-taglo-interface/list-views).

You will be able to use these list views similarly to how you use them in the main interface, including previewing items and creating/editing items.

## Launching new Wizards

**List Views** within a wizard behave in the same way as normal list views. That means that if the item you want to select doesn't exist yet, you can create it immediately and then select it. If the item you want to select needs editing, you can edit it right there and then, without having to move to another part of the application first.

When you open a new wizard from within a wizard, the new one will appear on top of the old one, with a visual indication that the previous wizard is waiting for you once you have finished. You can keep stacking wizards until you have finished all the tasks you need.

{% hint style="success" %}
This is how we help you stay within your train of thought. You should never have to worry about the order in which you perform tasks. When you find that an item you need doesn't exist, just open a new wizard and create the item **from wherever you are in the application**, and select it once you're done.
{% endhint %}

The GIF below shows this workflow in action:

<figure><img src="https://2847533834-files.gitbook.io/~/files/v0/b/gitbook-x-prod.appspot.com/o/spaces%2FVy65sax6FVoNo2UTlJ0x%2Fuploads%2F36o8pXiCWTPO7oAhBMna%2FTags%20wizard.gif?alt=media&amp;token=37c6bdde-6f14-4386-8be9-922597317f50" alt="GIF showing a user following a train of thought by stacking dialogs. The user is creating a tag. When it wants to create a relationship from the new tag to another tag, if the other tag does not yet exist, the user can just open a new dialog on top of the old one. The user does this twice, before returning to the original dialog."><figcaption><p>The Stacked Wizard workflow</p></figcaption></figure>


# Save/Undo/Redo

How you can undo/redo changes and restore old versions

Any time you make a change in Taglo software, the change is saved, so you never have to worry about losing work.

{% hint style="info" %}
For information about how your data is saved, and how to deal with it manually, see the [**Data Storage**](/using-taglo-software/data-storage) page.
{% endhint %}

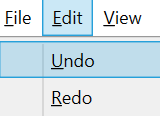
Models includes Undo and Redo functionality, which can be accessed through the Menu bar.

<figure><img src="https://2847533834-files.gitbook.io/~/files/v0/b/gitbook-x-prod.appspot.com/o/spaces%2FVy65sax6FVoNo2UTlJ0x%2Fuploads%2Fmx0zf8YhrJWyjCZ6i4M2%2Fimage.png?alt=media&amp;token=794bd398-e78f-431d-8238-a0942dad8e5f" alt="A screenshot showing the Undo/Redo buttons in the Edit menu."><figcaption><p>Undo/Redo in Edit menu</p></figcaption></figure>

You can use the keyboard shortcuts `Alt+E, U` and `Alt+E, R`, from wherever you are in the application to Undo/Redo.

Each **Model** also has a [**dedicated file history**](/models/home-tab/version-history) which you can use to return to a specific date/time.


# Keyboard Shortcuts

A list of common shortcuts

## Application shortcuts

General shortcuts:

<table data-header-hidden><thead><tr><th width="260">Shortcut</th><th>Action</th></tr></thead><tbody><tr><td><code>Alt</code> + <code>e</code>, <code>u</code> </td><td>Undo (see <a href="/using-taglo-software/the-taglo-interface/save-undo-redo"><strong>Undo/Redo</strong></a>)</td></tr><tr><td><code>Alt</code> + <code>e</code>, <code>r</code> </td><td>Redo (see <a href="/using-taglo-software/the-taglo-interface/save-undo-redo"><strong>Undo/Redo</strong></a>)</td></tr></tbody></table>

## List shortcuts

When working in any [**list of items**](/using-taglo-software/the-taglo-interface/list-views):

<table data-header-hidden><thead><tr><th width="260">Shortcut</th><th>Action</th></tr></thead><tbody><tr><td><code>Ctrl</code> + <code>n</code></td><td>Create a new item (opens new item dialog)</td></tr><tr><td><code>Ctrl</code> + <code>[Number]</code></td><td>Switch view (e.g. <code>Ctrl</code> + <code>2</code> to switch to second view)</td></tr></tbody></table>

When one or more items in a list are selected:

<table data-header-hidden><thead><tr><th width="260">Shortcut</th><th>Action</th></tr></thead><tbody><tr><td><code>Ctrl</code> + <code>e</code></td><td>Edit the currently selected item(s)</td></tr><tr><td><code>Ctrl</code> + <code>d</code></td><td>Duplicate the currently selected item(s)</td></tr><tr><td><code>Del</code></td><td>Delete the currently selected item(s)</td></tr></tbody></table>

## Wizard shortcuts

When working in a [**wizard**](/using-taglo-software/the-taglo-interface/using-wizards):

<table data-header-hidden><thead><tr><th width="260">Shortcut</th><th>Action</th></tr></thead><tbody><tr><td><code>Alt</code> + <code>n</code></td><td>Go to next page (if available)</td></tr><tr><td><code>Alt</code> + <code>b</code></td><td>Go to previous page</td></tr><tr><td><code>Alt</code> + <code>i</code></td><td>Finish and exit (if available) from any page</td></tr><tr><td><code>Alt</code> + <code>[Number]</code></td><td>Go to sub-step on page (e.g. <code>Alt</code> + <code>2</code> to go to second step)</td></tr><tr><td><code>Alt</code> + <code>0</code></td><td>Collapse all sub-steps on page</td></tr></tbody></table>

## Model Editor shortcuts

Shortcuts in the [**Model Editor**](/models/model-editor):

<table data-header-hidden><thead><tr><th width="260">Shortcut</th><th>Action</th></tr></thead><tbody><tr><td><code>Ctrl</code> + <code>q</code></td><td>Cycle through tabs</td></tr><tr><td><code>Ctrl</code> + <code>Shift</code> + <code>q</code></td><td>Cycle backwards through tabs</td></tr></tbody></table>


# Data Storage

How your data is stored and what this means for collaborating with others

## Data Overview

Taglo applications currently store data locally on your machine. You can set the location of this data from **File > Change data location**, which will bring up a prompt to choose a folder in which all of your data will be stored.

Taglo data is designed to be stored in a single folder, which all applications will access.

## Manipulating and Sharing Data

{% hint style="warning" %}
Taglo data is stored in human-readable files but should not be manually edited by the user, as this risks corrupting the files.
{% endhint %}

Taglo stores all of your data in a series of files that make up a local database, making it easy to search and organise your data.

As an example, **Tags** are accessible from all Taglo applications, so are not stored in the same files as, say, a **Model**. For your Model to function correctly, the software will need to access both Models and Tags data. This means that you can't simply move and access an individual Models file and expect it to work.

Unfortunately, this means that sharing a file via email, like you might be used to in Excel, is not straightforward. (Of course, you can still share non-Taglo outputs, such as the Excel spreadsheets that Models produces).

{% hint style="info" %}
We would like to enable formal sharing and collaboration tools in Taglo software as the product matures.

Until then, if sharing and collaboration is required, we recommend storing data in a shared drive location (e.g. using a file-sharing tool such as OneDrive or Dropbox). Each collaborator should then set their file location to the shared folder. In this model, **ensure** **that collaborators do not work on the same data simultaneously**, which could cause conflicts.

You can help avoid conflicts by working in different [**Namespaces**](/using-taglo-software/namespaces). Data from different namespaces are always stored in separate files.
{% endhint %}

## Refreshing Data

In all Taglo applications, pressing `F5` will reload the data from file - this should only be necessary if you or another user has altered the underlying data simultaneously from another application instance


# Namespaces

How to use Namespaces to organise data

## Overview of Namespaces

Namespaces are how Taglo allows you to organise your data into different "areas".

## Defining Namespaces

You can add and edit Namespaces from any list of namespaces, or use the Namespaces applet, accessible from the [navigation bar](/using-taglo-software/the-taglo-interface/navigating-in-models).

Give the Namespace a name, and select any other Namespaces that should be referenced by your new Namespace (explained below).

## Namespace References

Namespaces can reference other Namespaces. This ensures that the referenced Namespace is always loaded when the referrer is loaded.

As an example, you might have a Namespace called **Fruit**, which contains data and Tags about apples, bananas and oranges. You then create a new Namespace called **Recipes** which has data and Tags about all the things you like to cook, some of which contain apples, bananas and oranges. By referencing the Fruit Namespace from the Recipes Namespace, you ensure that when you're working with Recipes, you always have access to the apples, bananas and oranges data.

Conversely, you might build a [**Model**](/models/home-tab) to budget for your stamp collection over the next 5 years, so you create that Model in a **Stamp Collection** Namespace. This Namespace does not need to know about Recipes or Fruit, so you don't reference either of those Namespaces, which ensures you don't see irrelevant information when working on your Model.

{% hint style="info" %}
It's up to you how to manage your Namespaces.

Keeping them specific (like the Fruit example above) allows you a lot of flexibility, but means you will end up with a lot of Namespaces to keep track of and manage.

Putting everything in a few large Namespaces means you may have less to think about initially, but you will see more irrelevant items when working on a Model.
{% endhint %}


# Inbuilt data

Overview of data that comes built into Models

## Overview

Models comes with some data that is always available to you when using the software. This includes:

* Some Model templates
* Number Formats
* Useful Tags

You won't be able to edit or delete inbuilt items, though some inbuilt items (like Models) can be copied.

Inbuilt data can be easily identified by looking for the padlock icon, as shown in the example below:

<figure><img src="https://2847533834-files.gitbook.io/~/files/v0/b/gitbook-x-prod.appspot.com/o/spaces%2FVy65sax6FVoNo2UTlJ0x%2Fuploads%2F6JZw9vx8BYeR3KoNAffO%2Fimage.png?alt=media&amp;token=84000379-dba6-491a-ae5d-44200e4d43c3" alt="A screenshot of a section of the Home Tab, highlighting inbuilt Models as indicated by a locked padlock icon next to each inbuilt Model" width="563"><figcaption><p>Examples of inbuilt Models</p></figcaption></figure>

## Inbuilt Namespaces

You cannot add items to the inbuilt Namespaces. If copying an inbuilt item, you will be asked to choose a Namespace of your own to copy the item to.


# Introduction to Tags

Understanding key Tag concepts

## Overview

**Tags** are fundamental to how Taglo software works.&#x20;

As their name suggests, they can be used for "tagging", helping to categorise and search items, but with some extra layers of power built in: Tags can be linked to other Tags, creating a network that makes both tagging and searching easier and more effective.

The relationships between Tags makes them useful in other places too, and they form the basis for other concepts in [**Models**](/models/home-tab), such as [**Units**](/units/introduction-to-units) and [**Dimensions**](/dimensions/introduction-to-dimensions).

## Abstract vs. Concrete

Tags can be one of two types: `Abstract` and `Concrete`

<table><thead><tr><th width="159.33333333333331">Tag type</th><th width="417">Description</th><th>Example</th></tr></thead><tbody><tr><td><code>Abstract</code></td><td>Describes a type of object or concept that there can be one or more instances of (e.g., <strong>a</strong> <code>city</code>, <strong>a</strong> <code>country</code>, <strong>an</strong> <code>apple variety</code>, <strong>a</strong> <code>Taglo product</code>, <strong>an</strong> <code>emotional state</code>)</td><td><img src="https://2847533834-files.gitbook.io/~/files/v0/b/gitbook-x-prod.appspot.com/o/spaces%2FVy65sax6FVoNo2UTlJ0x%2Fuploads%2FnrNpR9kmhEJYvUMLCZyx%2Fimage.png?alt=media&amp;token=a4b2a58a-d975-40bf-86cc-5c0b16f7ff92" alt="" data-size="line"></td></tr><tr><td><code>Concrete</code></td><td>Describes a specific instance of an object, or a general concept of which there can be only one instance (e.g., <code>London</code>, <code>United Kingdom</code>, <code>Granny Smith</code> , <code>Models</code>, <code>happiness</code>)</td><td><img src="https://2847533834-files.gitbook.io/~/files/v0/b/gitbook-x-prod.appspot.com/o/spaces%2FVy65sax6FVoNo2UTlJ0x%2Fuploads%2Fc1vTh6AVBGXyLYp9pnqx%2Fimage.png?alt=media&amp;token=c87b844d-ff2b-4e19-a9f3-5aff79f6c1fa" alt="" data-size="line"></td></tr></tbody></table>

## Tag Relationships

Tags can have unlimited parents (and children).

There are two types of parent relationships:

1. `Is A`: Links to `Abstract` parents (e.g., <img src="https://2847533834-files.gitbook.io/~/files/v0/b/gitbook-x-prod.appspot.com/o/spaces%2FVy65sax6FVoNo2UTlJ0x%2Fuploads%2FBRdPYH60UBgJLC4PTgK9%2Fimage.png?alt=media&amp;token=267789a3-560e-49dd-977b-722596264028" alt="" data-size="line"> `Is A` <img src="https://2847533834-files.gitbook.io/~/files/v0/b/gitbook-x-prod.appspot.com/o/spaces%2FVy65sax6FVoNo2UTlJ0x%2Fuploads%2FON6GwNxj5Ee5cxan1bpe%2Fimage.png?alt=media&amp;token=d363fa25-64a8-4220-b966-31bf5c7f0c17" alt="" data-size="line">)
2. `Relates To`: Links to `Concrete` parents (e.g., <img src="https://2847533834-files.gitbook.io/~/files/v0/b/gitbook-x-prod.appspot.com/o/spaces%2FVy65sax6FVoNo2UTlJ0x%2Fuploads%2F4wMB4PLqpNbMNlxHnlsi%2Fimage.png?alt=media&amp;token=485d5028-f6e7-4743-b585-30c3de1ac243" alt="" data-size="line"> `Relates To` <img src="https://2847533834-files.gitbook.io/~/files/v0/b/gitbook-x-prod.appspot.com/o/spaces%2FVy65sax6FVoNo2UTlJ0x%2Fuploads%2FUfknCcM6G5djyFiu3Kif%2Fimage.png?alt=media&amp;token=e0f0eb50-582c-46de-8a58-99c93d32d50c" alt="" data-size="line">)

{% hint style="info" %}
Use the [Tags Applet](/tags/tags-applet) to quickly navigate between Tags and explore relationships
{% endhint %}

{% hint style="warning" %}
There is also an `Is Same As` relationship, which should only be used when duplicate Tags have been created and it would be difficult to remove one of the duplicates. In this case each Tag in the `Is Same As` relationship will inherit all parents of the other.
{% endhint %}


# Tag Basics

How to create and edit a Tag

## Setup step

You can create or edit a Tag from any list of Tags in a Taglo application. A dialog will be displayed as shown in the below screenshot.

<figure><img src="https://2847533834-files.gitbook.io/~/files/v0/b/gitbook-x-prod.appspot.com/o/spaces%2FVy65sax6FVoNo2UTlJ0x%2Fuploads%2FeXsDNGoWaYV5304sQvWy%2Fimage.png?alt=media&amp;token=fd4f4d9a-9528-4784-a69f-e97404ad7784" alt="Screenshot showing the Tag setup wizard. The user has entered a full name and a short name for the Tag." width="563"><figcaption><p>Setup step of Tag wizard</p></figcaption></figure>

### Name

A Tag name can be any non-blank text.

### Type

Choose between `Abstract` and `Concrete` Tag types (see explanation [**here**](https://help.taglo.io/tags/pages/xKXxhPqflNveH4QpWCHU#abstract-vs.-concrete)). This option may not be available in all Tag wizards, dependent on context (sometimes the Tag type will be pre-determined).

### Namespace

Each Tag must be assigned to a [**Namespace**](#namespace).

### Short Name

Optionally, you can enter a Short Name for your Tag. In some places, this name will be displayed instead of the full name. If left blank, the full name will always be displayed.

## Relationships

<figure><img src="https://2847533834-files.gitbook.io/~/files/v0/b/gitbook-x-prod.appspot.com/o/spaces%2FVy65sax6FVoNo2UTlJ0x%2Fuploads%2FnxjXrE2VWh3tP5rlLbEo%2Fimage.png?alt=media&amp;token=d652468a-9296-44d7-b5d2-3d7b3bab3fae" alt="Screenshot showing the relationships page of the Tag wizard. The user is creating a Tag for London, and has added an &#x22;Is A:&#x22; relationship to the &#x22;City&#x22; tag, and a &#x22;Relates to:&#x22; relationship to the &#x22;UK&#x22; tag" width="563"><figcaption><p>Relationships step of Tag wizard</p></figcaption></figure>

`Is A`, `Relates To`, and `Is Same As` relationships can be edited in the **Relationships** page of the dialog. There are no limits to the number of each relationship type that you select.

{% hint style="info" %}
Remember, you can create new Tags directly from each of the Relationship steps, so you can create a whole hierarchy of Tags on the fly.
{% endhint %}


# Tags Applet

Overview of the dedicated Tags applet

## Overview

<figure><img src="https://2847533834-files.gitbook.io/~/files/v0/b/gitbook-x-prod.appspot.com/o/spaces%2FVy65sax6FVoNo2UTlJ0x%2Fuploads%2F9hE4Rt4psVS9DoCOChDz%2Fimage.png?alt=media&amp;token=d2903a3c-ef6e-4b3e-9d5c-7bb926866258" alt="Screenshot showing the Tags applet, with the Tag for &#x22;South America&#x22; previewed, showing it&#x27;s child Tags (the counties in South America)"><figcaption><p>Tags applet</p></figcaption></figure>

The Tags application can be accessed from the navigation bar in [**Models**](/models/home-tab).

The Tags application is simply a display of all Tags in all [**Namespaces**](/using-taglo-software/namespaces). As with other Tag lists, the Tags can be displayed in a hierarchical view (as shown in screenshot above), as well as flat lists of all Tags.

{% hint style="info" %}
Note that a Tag may appear in multiple locations in the hierarchical view, as Tags can have multiple parents
{% endhint %}

## Previews and Navigation

In the full preview for a selected Tag you can see both parent and child relationships.&#x20;

Clicking on these parent and child Tags will take you to a preview of that item, and navigate to the Tag in the list. If you are in the hierarchical view, the first instance of the Tag in the list will be shown.

Parent relationships can be edited using the **Edit** functionality of the list to open a Tag wizard.

Child relationships can be edited by clicking on the specific Edit <img src="https://2847533834-files.gitbook.io/~/files/v0/b/gitbook-x-prod.appspot.com/o/spaces%2FVy65sax6FVoNo2UTlJ0x%2Fuploads%2F1x5yexvamjQfXxygSYiC%2Fimage.png?alt=media&amp;token=0c9bea07-f2f6-48d9-9a96-465a31b8ae1d" alt="" data-size="line">buttons in the Preview, which will open a dedicated dialog for editing either the `Concrete` or `Abstract` children.

### Reordering Children

Within the Child relationships wizard, children can be reordered by dragging and dropping.

## Direct children filter

Tags in the Tags application are searchable by Tags. The results shown depend on whether the **Direct children only** option is selected.

<figure><img src="https://2847533834-files.gitbook.io/~/files/v0/b/gitbook-x-prod.appspot.com/o/spaces%2FVy65sax6FVoNo2UTlJ0x%2Fuploads%2Ficgkg2yH5SsqwFUrNiNk%2Fimage.png?alt=media&amp;token=0d317281-8258-41c9-9f54-ca78141303da" alt=""><figcaption><p>Direct children only toggle</p></figcaption></figure>

By default, this option is selected, and filtering by a Tag will show only the direct children of that Tag. If this option is deselected, all descendants will be shown.


# Advanced Tags

Advanced Tag options

## Tag Properties

{% hint style="info" %}
Applicable to `Abstract` Tags only
{% endhint %}

Tag Properties can be used to add additional context to `Abstract` Tags in specific situations, primarily for performing complex [**Dimension**](/dimensions/introduction-to-dimensions)-based calculations in [**Models**](/models/home-tab).

> Tag Properties are best understood by seeing example use cases, such as using [**repeated Dimensions in a Variable**](/dimensions/dimension-setup#selecting-repeated-dimensions).

Tag Properties can be added from the **Advanced** step of the Tag dialog.

## Auto-create Tag Links

{% hint style="info" %}
Applicable to `Abstract` Tags only
{% endhint %}

When creating an `Abstract` Tag, you may want to simultaneously create a `Concrete` equivalent, and link it to parents of the Abstract Tag, as demonstrated in the example below

### Auto-create Example

![](https://2847533834-files.gitbook.io/~/files/v0/b/gitbook-x-prod.appspot.com/o/spaces%2FVy65sax6FVoNo2UTlJ0x%2Fuploads%2F53rRcneqKhrhL0AkJAIN%2Fimage.png?alt=media\&token=c59d058c-b619-4038-8a01-293ba95c0840)

Let's say we currently have two Tags, an `Abstract` Tag called `Fruit (a piece of)`, and a `Concrete` parent of `Fruit` called `Fruits`, which represents the general concept of all fruit.

Now let's say I want to add a new `Abstract` Tag called `Apple`, which will have `Fruit (a piece of)` as an `Abstract` parent (an Apple is a piece of Fruit).

I might simply add the new Tag, with the parent relationship and end up with the below.

![](https://2847533834-files.gitbook.io/~/files/v0/b/gitbook-x-prod.appspot.com/o/spaces%2FVy65sax6FVoNo2UTlJ0x%2Fuploads%2FV1wRzIuTKqdb3mRyXhrU%2Fimage.png?alt=media\&token=8cdc2e8f-02d0-4dcb-8884-514c6080769c)

However, if I later want to create a `Concrete` Tag to represent the general concept of `Apples`, I should also edit the `Apple` Tag (Apple relates to Apples), and link the new `Apples` Tag to `Fruits` (Apples relates to Fruits).

**Auto-create Tag Links** automates this step so that you don't need to think about it.

To achieve this, you would do the following when adding the `Apple` Tag:

1. Add `Fruit (a piece of)` as an `Is A` relationship in the relationships step
2. In the **Advanced** step, set **Auto create abstract tag links?** to `Yes`
3. In **Create parent or pick existing?**, select `Create new` (assuming there is no pre-existing `Apples` Tag)
4. The **Edit name for parent** text box should be pre-populated with "Apples" - this is the name for the `Concrete` parent that it will create
5. Click **Finish**.

This will produce the following result:

![](https://2847533834-files.gitbook.io/~/files/v0/b/gitbook-x-prod.appspot.com/o/spaces%2FVy65sax6FVoNo2UTlJ0x%2Fuploads%2FCNTqjtjV2WUQNoG3YTiV%2Fimage.png?alt=media\&token=fc7724fd-09b1-4efb-a5f9-c702200edcd1)

`Apple` is now linked to `Apples` and also to `Fruit (a piece of)`, and the auto-created `Apples` Tag is linked to `Fruits`.

{% hint style="info" %}
It's up to you to decide how much detail to create in your Tags, depending on what you use them for.

In some situations, it's good to keep Tags as organised as possible, as in the example above, in which case this function is useful for consistency, and a timesaver.

In other situations, this level of organisation is overkill. **Auto-create Tag Links?** is set to `No` by default, so if needed, you can create an `Abstract` Tag simply by entering a Name, choosing a Namespace and pressing **Finish**.
{% endhint %}


# Home Tab

The starting point for Models

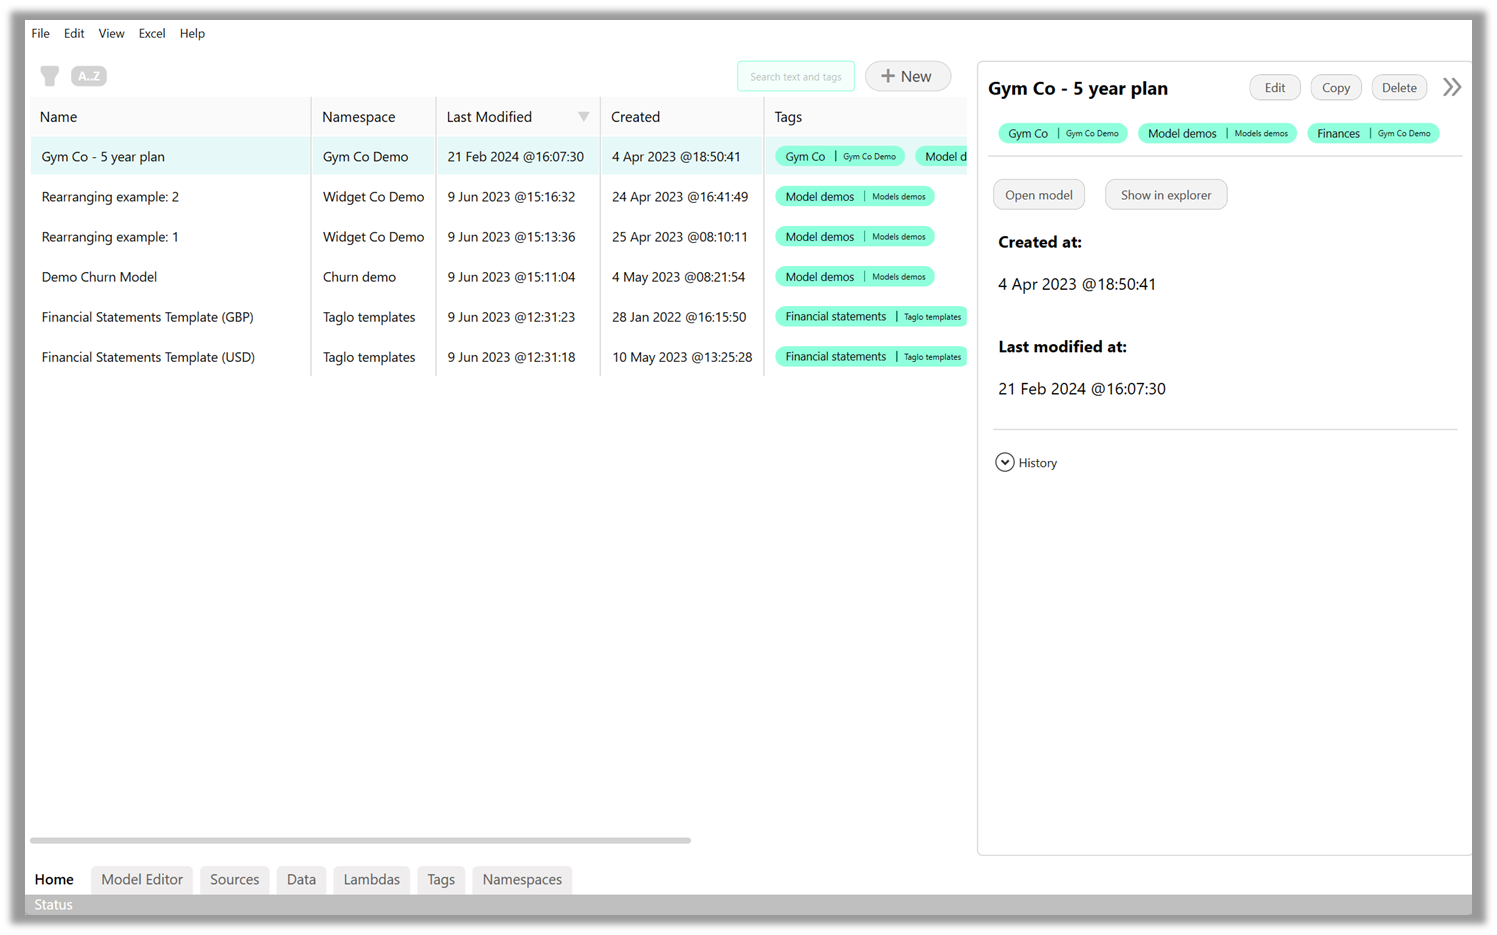
<figure><img src="https://2847533834-files.gitbook.io/~/files/v0/b/gitbook-x-prod.appspot.com/o/spaces%2FVy65sax6FVoNo2UTlJ0x%2Fuploads%2Fe3LEy9vmnxujS0qAgxwu%2Fimage.png?alt=media&amp;token=012cde7f-2b2b-434c-a3e4-7dbbca7ae3e8" alt="Screenshot showing the Home Tab of Models. There are several Models shown in a list - the user has selected the first Model, a preview of which is being shown on the right hand side."><figcaption><p>The Models Home Tab</p></figcaption></figure>

The **Home Tab** in Models is the first screen that you see when you open the application.

In the Home Tab you can:

1. Search for existing Models
2. [**Create a new Model**](/models/home-tab/creating-a-model)
3. Edit the name, [**Namespace**](/using-taglo-software/namespaces) and [**Timings**](/models/home-tab/creating-a-model/timings) of a Model, and apply [**Tags**](/tags/introduction-to-tags)
4. Open a Model for editing
5. [**Restore previous versions**](/models/home-tab/version-history) of a Model
6. Edit Application settings


# Creating a Model

How to create a new Model

[**The "Add New Item"**](/using-taglo-software/the-taglo-interface/adding-items) wizard for Models comprises 2 pages.&#x20;

## 1. Setup

To create a Model, you must at a minimum give it a **Name** and select a [**Namespace**](/using-taglo-software/namespaces)**.** Optionally, you can add Tags to your Model, which will help you find it and related Models in the Home Tab.

You are free to select any Namespace for your model, but we recommend using a new Namespace for each Model. This gives you maximum flexibility without worrying about the impact of your work on other Models/Namespaces.

{% hint style="info" %}
If you want to reuse Tags/Dimensions across Models, you can put those Tags in a common Namespace which you then reference from the Model's Namespace. See [**here**](/using-taglo-software/namespaces) for more information on how to use Namespaces.
{% endhint %}

## 2. Timings

New Models have default [**Timings**](/models/home-tab/creating-a-model/timings) of 10 years, starting in the current year.

You can change Timings when creating the Model, or in the [**Model Editor**](/models/model-editor) at any point. Read on for more details on how Timings work in Models.


# Timings

Setting up Model Timings

## Overview

Each **Model** performs its calculations over a period of time that you define, whether that be 5 days, or 20 years. Every [**Variable**](/variables/variable-basics) in the Model will have a value for each separate time interval in the model.

You can choose:

1. The [**Interval Type**](#interval-type) of the model (Days, Months, Years...)
2. The [**Start/End/Duration**](#start-end-duration) of the model
3. The [**Fiscal Year End**](#fiscal-year-end)

## Interval Type

Models offers 5 interval types: Day; Week; Month; Quarter; Year

This determines the length of an individual period of the Model.&#x20;

{% hint style="info" %}
Individual Model periods are always consecutive, and of the length of 1 interval. e.g. if the first period of a Model is a Week, ending on Friday 6th January 2023, the second period will be the week ending Friday 13th January 2023.
{% endhint %}

## Start/End/Duration

You must define the beginning and end of your Model Timings, which you can do by setting **any 2** of:

1. Start date
2. Duration (in number of intervals)
3. End date&#x20;

Setting any 2 of these will automatically update the third.

{% hint style="info" %}
There is no defined limit to the number of intervals to use in your Model, but be aware using a large number of intervals (e.g. >100) may cause performance issues, depending on Model complexity.
{% endhint %}

Start/End dates are entered as text, with the format determined by the selected Interval Type, as shown in the example image and table below.

<figure><img src="https://2847533834-files.gitbook.io/~/files/v0/b/gitbook-x-prod.appspot.com/o/spaces%2FVy65sax6FVoNo2UTlJ0x%2Fuploads%2FkYVbTzq7XtxTr3ZDNL8E%2Fimage.png?alt=media&amp;token=91f7471c-32e1-4b47-b5f5-36909a57ba4e" alt=""><figcaption><p>Start/End date entry</p></figcaption></figure>

### Start/End Date text formats

<table><thead><tr><th width="221.33333333333331">Interval Type</th><th width="153">Text Format</th><th>Notes</th></tr></thead><tbody><tr><td>Day</td><td>yyyyMMdd</td><td>Year/Month/Day</td></tr><tr><td>Week</td><td>yyyyMMdd</td><td>Refers to the 7-day period ending at the entered date</td></tr><tr><td>Month</td><td>yyyyMM</td><td>Year/Month. Precise date will depend on <a href="#fiscal-year-end"><strong>Fiscal Year End</strong></a> settings.</td></tr><tr><td>Quarter (Option 1)</td><td>yyyyQ[1-4]</td><td>Precise date will depend on Fiscal Year End settings. <br><br>e.g. <strong>2020Q4</strong> refers to the last quarter of the 2020 fiscal year. If Fiscal Year End is set to March (End of Month), the precise date will be <strong>31st March 2020</strong>.</td></tr><tr><td>Quarter (Option 2)</td><td>yyyyMM</td><td>Precise date will depend on Fiscal Year End settings. <br><br>e.g. <strong>202003</strong> refers to March 2020. If Fiscal Year End is set to March (End of Month), this will be equivalent to <strong>2020Q4</strong> (31st March 2020).<br><br>A quarter entered in this format must be a valid quarter end month.</td></tr><tr><td>Year</td><td>yyyy</td><td>Precise date will depend on Fiscal Year End settings. </td></tr></tbody></table>

## Fiscal Year End

The Fiscal Year End (FYE) is how a business defines the end of its operating year, for accounting purposes.

e.g. a company's FYE might be 31st March, meaning that its company accounts will cover the period from 1st April one year to 31st March the next.

In the vast majority of instances, the FYE is at the end of the month (e.g. 31st Dec, 28th/29th February, 31st March). However, Models allows you to define an FYE at a specific day in a month (from 1-31). If a quarter ends in a month that has fewer days than the day specified, the end of that month will be used.

{% hint style="info" %}
Not all Models will be financial in nature, but you can still use the FYE to define when your intervals end.

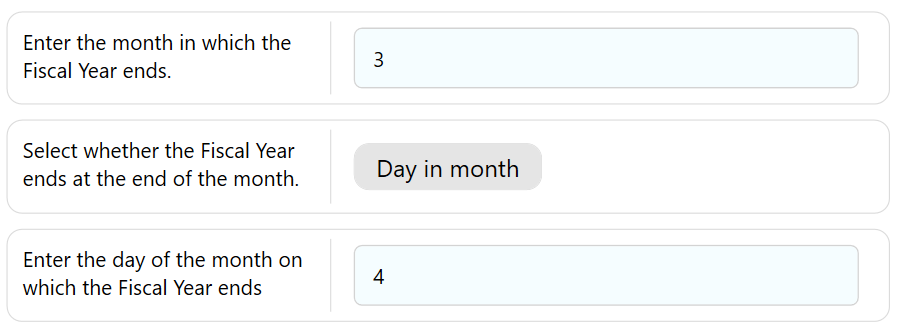
e.g. if you want a yearly model that starts on March 5th every year, you would set the FYE as shown in the image below.&#x20;
{% endhint %}

<figure><img src="https://2847533834-files.gitbook.io/~/files/v0/b/gitbook-x-prod.appspot.com/o/spaces%2FVy65sax6FVoNo2UTlJ0x%2Fuploads%2FHXVxQJhb0RaSmTNlvJhP%2Fimage.png?alt=media&amp;token=8d995a35-af41-4b2e-a765-4198632683cf" alt="Shows Fiscal Year End month entered as 3 (March), End of Month option selected as &#x22;Day in month&#x22;, and day of month entered as 4"><figcaption><p>Fiscal Year End entry</p></figcaption></figure>


# Version History

How to restore previous versions of your Models

## Restoring old versions

By default, we will store a new version of your Model for **every** change that you make. You can use [**Undo**](/using-taglo-software/the-taglo-interface/save-undo-redo) to quickly undo changes, but to access old versions more easily, you can use the **History** panel in the Model preview in the Home Tab.

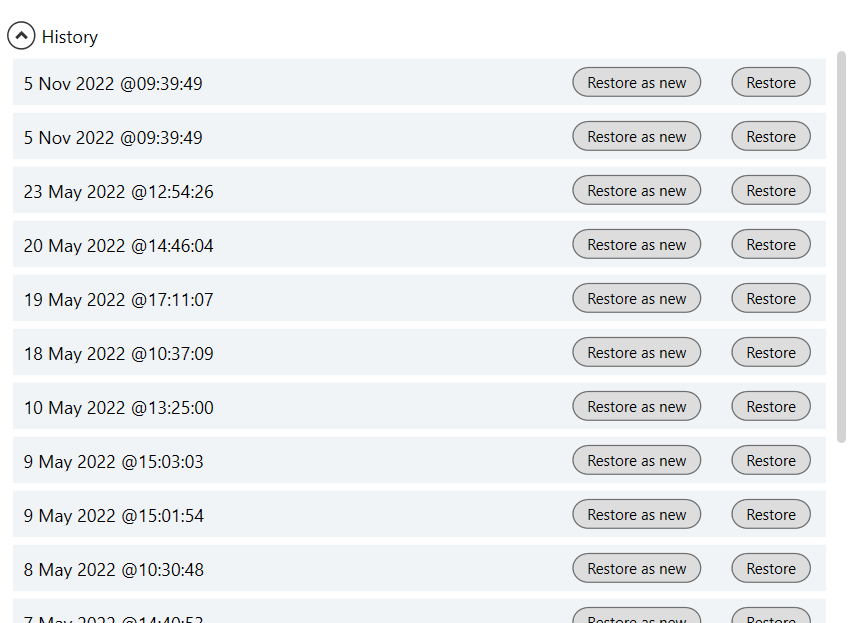
The History panel shows you all available previous versions of the Model, with the date and time at which they were created. For each version, you have the option to **Restore as new**, or **Restore**.

**Restore as new** will create a new Model, starting at the restore point. **Restore** will overwrite the current version with the previous, ***so use this option with care***.

<figure><img src="https://2847533834-files.gitbook.io/~/files/v0/b/gitbook-x-prod.appspot.com/o/spaces%2FVy65sax6FVoNo2UTlJ0x%2Fuploads%2F9rKKMjAw2WuZxMMVe0jb%2Fimage.png?alt=media&amp;token=bcab916b-c383-4064-a894-d5bea4535852" alt=""><figcaption><p>History Panel</p></figcaption></figure>

## Reducing history size

If you want to reduce the size of the version history on disk, you can run a clean up of old files, by clicking on **File > Clean old files** in the Home Tab.

This will keep one version per day for all Models, and delete all other versions. Currently, **Clean old files** can only be used across all Models simultaneously.


# Application Settings

Home Tab settings

Access Models application settings by clicking **Edit > Edit Settings** from anywhere within the application.

A wizard will be opened in which settings can be edited.

### Default Theme

Choose a Default Theme to use for new Models. Themes are used to format generated Excel spreadsheets. Read more about Themes [**here**](/layout/excel-formatting/excel-themes-and-styles).


# Model Editor

Overview of the Model Editor

<figure><img src="https://2847533834-files.gitbook.io/~/files/v0/b/gitbook-x-prod.appspot.com/o/spaces%2FVy65sax6FVoNo2UTlJ0x%2Fuploads%2FRHDNTSERkxsoqEpwmTR4%2Fimage.png?alt=media&amp;token=fda32148-eff9-4df7-8937-6cde48a113dd" alt="Screenshot of the Model Editor interface showing a Model with a Variable selected, and a preview of that Variable shown"><figcaption><p>Screenshot of Model Editor interface</p></figcaption></figure>

The Model Editor is the primary applet you will use when editing Taglo Models. Viewing some of our [**video tutorials**](/start-here/tutorials#introductory-tutorials) is a great way to get to know the interface.

### Editor Tabs

You can access the various functions of the Model Editor by navigating through the tabs on the left-hand side of the application from **Variables** to **Excel Outputs.**

{% hint style="info" %}
Use the `Ctrl + q` and `Ctrl + Shift + q` [**shortcuts**](/using-taglo-software/the-taglo-interface/keyboard-shortcuts) to move quickly between tabs
{% endhint %}

Each tab displays a [**List View**](/using-taglo-software/the-taglo-interface/list-views#overview) showing different components of your model. Continue reading the documentation to understand each one.

## Model settings bar

<figure><img src="https://2847533834-files.gitbook.io/~/files/v0/b/gitbook-x-prod.appspot.com/o/spaces%2FVy65sax6FVoNo2UTlJ0x%2Fuploads%2FRmWONuzinqGQLXqSw3MG%2Fimage.png?alt=media&amp;token=6b90799c-a8cb-4c73-a80a-4632d544379c" alt="Screenshot of the Model Settings bar"><figcaption><p>The Model Settings bar</p></figcaption></figure>

The Model Settings bar is positioned at the top of the Model Editor, and can be hidden or shown as desired using the expander button at the top left.

The settings bar allows you to edit Model Timings, Scenarios and Sensitivities, and perform various other functions, each of which is described in more detail in the relevant section of documentation.

## Model settings

Clicking **Edit** in the **Model Settings** section opens a wizard in which you can edit other Model-specific settings including:

* Model [**Theme**](/layout/excel-formatting/excel-themes-and-styles#default-and-model-themes)
* Default [**Number Format**](/number-formats/number-formats)
* Default [**Unit**](/units/introduction-to-units)
* Various Excel formatting settings


# Variable Basics

What are Variables?

## Overview

**Variables** are the items that form the logic of your model. Imagine you're building a forecast budget for your business. Examples of Variables might be: **Total Revenues**; **Number of Employees**; **Office Costs.**

{% hint style="info" %}
If you're used to working in Excel, you can think of Variables as like the lines in your model, but a lot more powerful
{% endhint %}

Variables can reference inputs to the model (called [**Assumptions**](/assumptions/introduction-to-assumptions)), or they can reference other Variables, through [**Calculations.**](/calculations/introduction-to-calculations)

A Calculation might look something like:

```
Profits = Revenues - Costs
```

In this way, you can link Variables to each other and develop the structure of your model.

The rest of this section explains how to configure Variables and the huge range of ways you can work with them.

## The Variables list view

By default, Variables are shown in a [**Tree View**](/using-taglo-software/the-taglo-interface/list-views#view-types), but you can also view them in a flat list, or a grid.

<figure><img src="https://2847533834-files.gitbook.io/~/files/v0/b/gitbook-x-prod.appspot.com/o/spaces%2FVy65sax6FVoNo2UTlJ0x%2Fuploads%2FTFKyMk7JsGaoeVISikaf%2Fimage.png?alt=media&amp;token=68787089-7f4b-4ff0-b05c-c26c3119dfe0" alt=""><figcaption><p>Variable Tree View</p></figcaption></figure>

In the Tree View, as shown above, the tree represents the relationships between the Variables. In this example, `Revenues by region` references `Revenues by region and membership type`, which in turn has a Calculation of `Gym members * Revenue per member`, hence these two Variables are shown as its children.

Using the Tree View, you can quickly navigate the relationships between Variables to understand and interrogate Calculations.

## The Variables preview

Each Variable in the list can be [**previewed**](/using-taglo-software/the-taglo-interface/previewing-and-editing) in detail, as per the example below:

<figure><img src="https://2847533834-files.gitbook.io/~/files/v0/b/gitbook-x-prod.appspot.com/o/spaces%2FVy65sax6FVoNo2UTlJ0x%2Fuploads%2FiSU31NifRzlW0raqqAVF%2Fimage.png?alt=media&amp;token=938a32e6-e8de-40ad-9e77-8cfbe7f52c30" alt=""><figcaption><p>Example Variable Preview</p></figcaption></figure>


# Variable Setup

How to create and configure a Variable

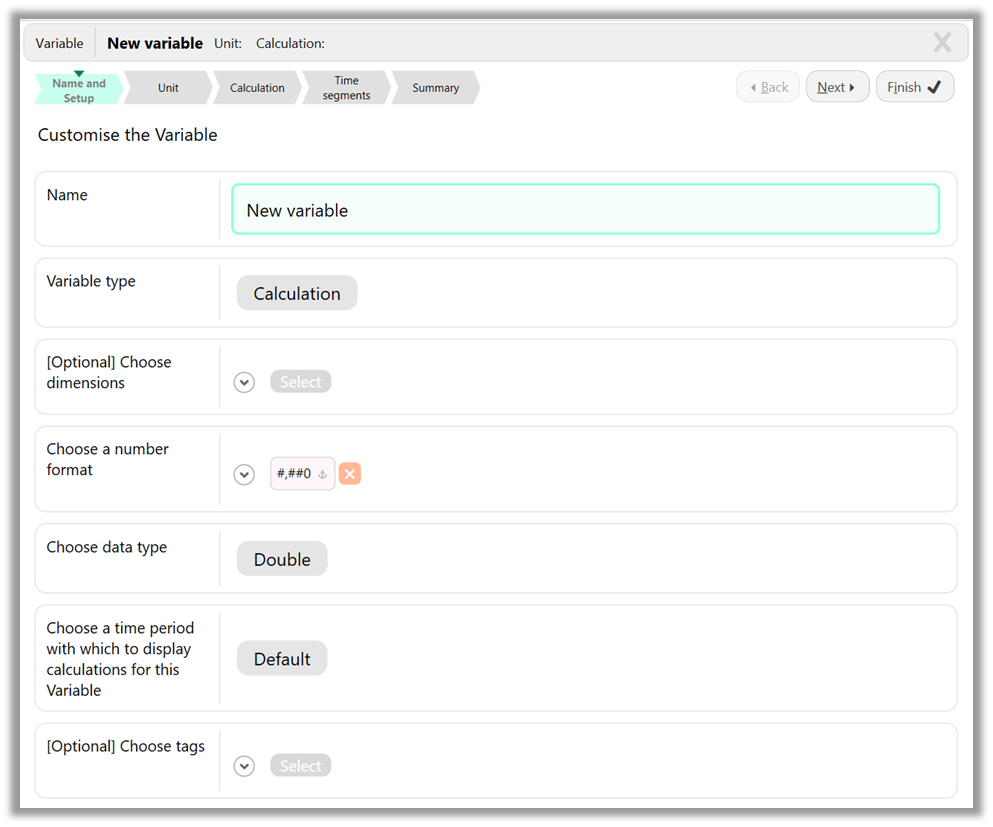
The items on this page can all be configured on the **Name and Setup** step of the Variable dialog.

<figure><img src="https://2847533834-files.gitbook.io/~/files/v0/b/gitbook-x-prod.appspot.com/o/spaces%2FVy65sax6FVoNo2UTlJ0x%2Fuploads%2FkNhNjQzU4EilbBnDOTKI%2Fimage.png?alt=media&amp;token=0a4ed75e-6512-4010-b94c-f6b005cd991d" alt="A screenshot of the Setup step of the new Variable dialog, containing several steps" width="563"><figcaption><p>Variable dialog | Name and Setup step</p></figcaption></figure>

## Name

There are no restrictions to how you name your Variables, as long as the name isn't blank. Make them as readable and self-explanatory as possible and thank yourself later!

{% hint style="info" %}
Bear in mind that if you will be generating Excel from your Model, Variable names will be written in the spreadsheet, meaning you should avoid choosing a name that Excel will interpret as a formula, otherwise you will run into problems. But if you really want to start a name with an "=", we won't stop you.
{% endhint %}

## Variable type

There are three types of variables in Models:

1. Assumption
2. Calculation
3. Aggregation

The **Variable type** you choose determines the default way that the Variable will calculate its value. Variables can calculate values from both **Assumptions** and **Calculations** in different periods of the model by using Time Segments. See the [**dedicated help section on Time Segments**](/variables/time-segments) for more details. **Aggregation** Variables must calculate value via aggregation for the entire model period.&#x20;

### Assumption Variables

Assumption Variables are usually the starting point of your Model. They reference the basic inputs, called Assumptions, that underpin your Model's calculations. Read more on how Assumptions work [**here**](/assumptions/introduction-to-assumptions)**,** and how to reference them from your Variable [**here**](/assumptions/creating-referencing-assumptions).

### Calculation Variables

Calculation Variables obtain their values by referencing other Variables and performing a calculation. e.g. `Profits = Revenues - Costs.`

Read more about Calculations [**here**](/calculations/introduction-to-calculations)**.**

### Aggregation Variables

{% hint style="warning" %}
You will only see the **Aggregation** option if you have already selected one or more [**Dimensions**](#dimensions) for your Variable ([see below](#dimensions)).
{% endhint %}

Aggregation allows you to bring values from several separate Variables together into a single Variable.

Read more about Aggregation [**here**](/aggregation/introduction-to-aggregation).

## Dimensions

Select any [**Dimensions**](/dimensions/introduction-to-dimensions) that you want to apply to your Variable. Dimensions allow you to work with a collection of items without having to repeat calculations.

> For example, a Dimension might be:
>
> * **Widget Model** | Model A, Model B, and Model C
>
> or
>
> * **Sales Region** | North, East, West, and South

Dimensions are extremely powerful, time-saving, and improve the quality of your Models. Read more about how to use Dimensions [**here**](/dimensions/introduction-to-dimensions).

## Number Format

A Number Format determines how the calculated values for your Variable will be displayed. You can choose from inbuilt Number Formats or create your own. Any Assumptions you create from within the Variable will use the same Number Format by default.

Read more about Number Formats [**here**](/number-formats/number-formats).

## Data Type

Models works with several Data Types, which affect how values are treated in calculations.

These include Data Types for working with numerical values, text values, date-time values and others.

Read more about the different Data Types and how to work with them [**here**](/data-types/data-types).

### Validation Dimension

The Validation Dimension step will only appear if you select the `Validation` **Data Type**. Validation allows you to select inputs from a list of values.

> For instance, a Variable called `Include tax?` may be an Assumptions Variable where you want to choose between `Yes/No` options. To achieve this, select the `Validation` Data Type, and then select the inbuilt `Yes/No Option` Dimension in the Validation Dimension step.

The Validation chosen here will be applied to any Assumptions created from this Variable. You can use any Dimension for Validation.

## Time Period

You may want to see outputs from your Model on a different timescale to that defined in the Model [**Timings**](/models/home-tab/creating-a-model/timings).&#x20;

> For instance, for a Model built on a Monthly basis, you may want to see outputs in Quarters or Years

How Models calculates the value for each aggregated period depends on the Unit of the Variable. `Balance` Variables will calculate the value at the end of the period, and `Flow` Variables will sum the values of intervening periods. Read more about `Balance` and `Flow` concepts in the [**Units documentation**](/units/introduction-to-units).

{% hint style="info" %}
If you select a Time Period other than `Default`, your Variable will automatically be a Calculation Variable, and you will not be able to edit [**Time Segments**](/variables/time-segments).
{% endhint %}

## Tags

You can Tag Variables just like any other taggable item in Taglo software, which will allow you to filter the list of Variables by those Tags.

Read more about Tags and tagging [**here**](/tags/introduction-to-tags).&#x20;


# Unit and Calculations

Entering Unit and Calculation for a Variable

The **Unit** and **Calculation** of a Variable (if required), each have a dedicated step in the Variable wizard.

<figure><img src="https://2847533834-files.gitbook.io/~/files/v0/b/gitbook-x-prod.appspot.com/o/spaces%2FVy65sax6FVoNo2UTlJ0x%2Fuploads%2FpqHEMsKni1WrzrGuP2Vc%2Fimage.png?alt=media&amp;token=5831aab3-7f27-4de8-b950-ffb35a07f8fa" alt="Two screenshots. The left hand side screenshot shows the Units step of the Variables dialog. The right hand side shows the Calculation step of the Variables dialog."><figcaption><p>Unit and Calculation steps of the Variable dialog</p></figcaption></figure>

{% hint style="info" %}
If this is your first time defining a Unit, we recommend reading the [**Introduction to Units**](/units/introduction-to-units) first
{% endhint %}

## Infer/Specify unit

A Calculation Variable can derive its Unit automatically, based on the Variables that it references.

> For instance, a Variable called `Revenues` has a Calculation `= Widgets Sold * Price`, where `Widgets Sold` has a Unit of `Widget`, and `Price` has a Unit of `US Dollars / Widget`. In this case, the Revenues Variable can infer that its Unit is `US Dollars`

Sometimes you will want to specify the Variable's Unit explicitly. In this case, select the **Specify Unit** option, and the Unit-editing page of the dialog will be shown.

> For instance, a Variable called `Customers` has a Calculation = `Customers [-1] + New customers`. This Variable references the previous period of itself, so cannot infer its Unit automatically. In this case, you will need to specify the Unit explicitly.

Read more about Units [**here**](/units/introduction-to-units).

{% hint style="info" %}
You will only see the Infer/Specify unit step if you have selected the **Calculation** Variable type. **Assumption** and **Aggregation** Variables must specify Units explicitly.
{% endhint %}


# Time Segments

Overview of Time Segments

## Overview

**Time Segments** allow a [**Variable** ](/variables/variable-basics)to calculate its values differently depending on the period of the [**Model**](/models/home-tab).

<figure><img src="https://2847533834-files.gitbook.io/~/files/v0/b/gitbook-x-prod.appspot.com/o/spaces%2FVy65sax6FVoNo2UTlJ0x%2Fuploads%2FLmaqMGOMeMMJfQIdgw98%2Fimage.png?alt=media&amp;token=bd38ac82-2bd9-42e1-bc0e-ef1793f7c5c5" alt="Shows the preview panel of a Variable with two Time Segments" width="563"><figcaption><p>Example Variable with two Time Segments</p></figcaption></figure>

For instance, in the example above, the `Monthly price per member` Variable calculates its value using an inflation [**Calculation**](/calculations/introduction-to-calculations): `Monthly price per member [-1] * (1 + Price inflation)`.

This Variable references the previous period's value of itself (indicated by the `[-1]` part of the Calculation). At the start of the Model, we need to tell the Variable what that value should be, as there are no previous periods to obtain the value from.

We do this by creating a new Time Segment for the first period of the Model, which will act as an `Assumption` segment, which we can link to the inputs of the Model. The second Time Segment is an `Auto` segment, meaning it performs the default Calculation of the Variable.

The rest of this section explains the various ways of creating and manipulating Time Segments, and the implications of using them.


# Time Segment Setup

How to create and edit Time Segments

## Creating/Editing Time Segments

Time Segments are managed in the Time Segments step of the **Variable** dialog.

<div data-full-width="false"><figure><img src="https://2847533834-files.gitbook.io/~/files/v0/b/gitbook-x-prod.appspot.com/o/spaces%2FVy65sax6FVoNo2UTlJ0x%2Fuploads%2FnNJMJVgsfV3Z8gHA7TAc%2Fimage.png?alt=media&amp;token=0924f0af-5679-4d2c-9380-e681d812b3f7" alt="Screenshot of the Time Segments step of the Variables wizard"><figcaption><p>Time Segment step of the Variable dialog</p></figcaption></figure></div>

You can add, edit and duplicate Time Segments just like any other item in a [**list view**](/using-taglo-software/the-taglo-interface/list-views).

## The Time Segment Wizard

### Timings

You must define the time period over which each Time Segment applies. This time period is defined in terms of three settings:

1. **From**: The period at which the segment starts
2. **Duration**: The length of the segment
3. **To**: The period at which the segment ends

As shown in the screenshot below, these settings can be quickly edited by clicking on the relevant editing shortcut button <img src="https://2847533834-files.gitbook.io/~/files/v0/b/gitbook-x-prod.appspot.com/o/spaces%2FVy65sax6FVoNo2UTlJ0x%2Fuploads%2Fpx4o9khfY6Np9Oovyef6%2Fimage.png?alt=media&amp;token=cee17f0b-c584-4df6-8da4-9d31072fc5c0" alt="" data-size="line">.

<figure><img src="https://2847533834-files.gitbook.io/~/files/v0/b/gitbook-x-prod.appspot.com/o/spaces%2FVy65sax6FVoNo2UTlJ0x%2Fuploads%2FAzsvvD0cPBZDy9QrUj2n%2Fimage.png?alt=media&amp;token=94e21f5a-7376-4c35-bd5a-1f945189ea59" alt="Screenshot showing two Time Segments with timings editing shortcut buttons highlighted"><figcaption><p>Timings editing shortcuts </p></figcaption></figure>

**From** and **To** settings can be set to one of the following:

<table><thead><tr><th width="241">From/To setting</th><th>Details</th></tr></thead><tbody><tr><td><code>Auto</code></td><td><p>Period dependent on context:</p><ul><li>If first segment, From will be set to the start of the model</li><li>If last segment, To will be set to the end of the model</li><li>If other, From/To will be based on end or beginning of adjacent segments).</li></ul></td></tr><tr><td><code>Fixed Period</code></td><td>Choice of specific periods from the Model timings (e.g. Q2 2030)</td></tr><tr><td><code>Periods from Start</code></td><td>Number of periods from start (first period = 1 )</td></tr><tr><td><code>Periods from End</code></td><td>Number of periods from end (last period = 1)</td></tr></tbody></table>

**Duration** can be set to one of the following:

<table><thead><tr><th width="242">Duration setting</th><th>Details</th></tr></thead><tbody><tr><td><code>Fill</code></td><td>Segment will stretch to end of previous period and beginning of next (or to start/end of the model if first/last segment)</td></tr><tr><td><code>Number of periods</code></td><td>Segment will occupy the specified number of periods</td></tr></tbody></table>

{% hint style="warning" %}
You should apply a **maximum of 2** of the three settings. Which settings are applied depends on the Time Segment.&#x20;

For instance, the first Time Segment never needs to have the **From** setting applied, as it always starts at the first period. If you set **From** to a period that is not the first period, a warning will be shown.

Likewise, if you set both the **Duration** and the **To** settings of the first Time Segment, one of these will be redundant, and they may clash.
{% endhint %}

### Formula

The **Formula** of a Time Segment determines how that Time Segment calculates its values.

There are five possible formula types for each Time Segment:

<table><thead><tr><th width="169">Formula Type</th><th>Details</th></tr></thead><tbody><tr><td><code>Auto</code></td><td>Applies the default <a href="/calculations/introduction-to-calculations"><strong>Calculation</strong></a> of the Variable. (This option is not available for an <a href="/variables/variable-basics/variable-setup#variable-type"><strong>Assumptions Type</strong></a> Variable).</td></tr><tr><td><code>Assumptions</code></td><td>Links to specific <strong>Assumptions</strong>. See <a href="/assumptions/creating-referencing-assumptions"><strong>Creating/Referencing Assumptions</strong></a> for more details.</td></tr><tr><td><code>Calculation</code></td><td>Applies a custom Calculation that cannot refer to other Variables. (See more details below).</td></tr><tr><td><code>Aggregation</code></td><td><p>Used for an <a href="/aggregation/introduction-to-aggregation"><strong>Aggregation</strong></a> Variable.</p><p></p><p><em>Cannot be manually selected - applied automatically when using Aggregation.</em></p></td></tr><tr><td><code>Rearranged</code></td><td><p>Used when <a href="/rearranging/introduction-to-rearranging"><strong>Rearranging</strong></a>.</p><p></p><p><em>Cannot be manually selected - applied automatically when Rearranging</em></p></td></tr></tbody></table>

#### Calculation Formula

<figure><img src="https://2847533834-files.gitbook.io/~/files/v0/b/gitbook-x-prod.appspot.com/o/spaces%2FVy65sax6FVoNo2UTlJ0x%2Fuploads%2FIiNPuUe93vK6vg04NrWo%2Fimage.png?alt=media&amp;token=b994cbf7-4726-4edc-8b20-0ddd606847ab" alt="Screenshot showing a Variable where the second time segment is set to a Calculation formula, referencing the previous period"><figcaption><p>Example of Calculation Formula</p></figcaption></figure>

As shown in the above example, a Time Segment with a Calculation formula acts similarly to an Assumptions Time Segment.

In this example, `Price inflation` is a Variable of type `Assumptions`. In the first period, an Assumptions Time Segment links to an input. We then use a Calculation Time Segment for the remaining periods to reference the previous period, rather than linking to specific Assumptions for each period of the Model.

{% hint style="info" %}
`Calculation` Time Segments act similarly to `Assumptions`, in that they specify an **input** to the Model. For this reason, calculations in Time Segments cannot reference other Variables.

If you want to perform a calculation referencing other Variables, the Variable itself must be of type `Calculation.`

If you are not sure when to use Assumption/Calculation Variables and Assumption/Calculation Time Segments, you may want to read about the [**Rearranging feature**](/rearranging/rearranging-example), which helps deal with complex scenarios.
{% endhint %}

## Time Segment shortcuts

<figure><img src="https://2847533834-files.gitbook.io/~/files/v0/b/gitbook-x-prod.appspot.com/o/spaces%2FVy65sax6FVoNo2UTlJ0x%2Fuploads%2FcQQk2aD8BB8YWQz3xXjC%2Fimage.png?alt=media&amp;token=b03e7f9a-2c86-4cb4-935b-7f549a9282e9" alt="Screenshot showing the Time Segments step of the Variable wizard, highlighting the shortcut buttons used for editing Time Segments"><figcaption><p>Time Segment shortcuts</p></figcaption></figure>

Several shortcuts are provided in the Time Segment interface to speed up some common operations, as shown in the image above.

<table><thead><tr><th width="222">Shortcut</th><th>Details</th></tr></thead><tbody><tr><td>1) Insert period</td><td>Inserts a period of duration <strong>1 period</strong> at the start of the Model</td></tr><tr><td>2) Make all equal to first period</td><td>Inserts a single period segment of type <code>Assumptions</code> at the start of the Model, and a second segment with a <code>Calculation</code> of <code>Variable [-1]</code> for the rest of the Model timings (as per the example shown in the image above).</td></tr><tr><td>3) Change formula type</td><td>Opens a dropdown to quickly switch between formula types.</td></tr><tr><td>4) Reset to default segment type</td><td>For a <strong>Calculation</strong> Variable, resets Time Segment to <code>Auto</code>. For an <strong>Assumptions</strong> Variable, resets Time Segment to <code>Assumptions</code>.</td></tr></tbody></table>


# Summaries

Editing Row and Columns Summaries of Variables

## Overview

<figure><img src="https://2847533834-files.gitbook.io/~/files/v0/b/gitbook-x-prod.appspot.com/o/spaces%2FVy65sax6FVoNo2UTlJ0x%2Fuploads%2FFFP2S0aKCa4gbvVu0Lvo%2Fimage.png?alt=media&amp;token=52cf01cc-812e-45dc-905a-ca18af7ad837" alt=""><figcaption><p>Summary step of Variable dialog</p></figcaption></figure>

Variables can be summarised in two ways, both accessible from the **Summary** step of the **Variable** wizard.

## Row Summary

A **Row Summary** is only applicable when the Variable has one or more [**Dimensions**](/dimensions/introduction-to-dimensions) applied. For instance, in the example below, the Variable has a `Membership Tier` Dimension applied, with three items: `Basic`, `Premium`, and `Platinum`.

The Row Summary determines how the **All** line is calculated (in this case, a `Sum`).

<figure><img src="https://2847533834-files.gitbook.io/~/files/v0/b/gitbook-x-prod.appspot.com/o/spaces%2FVy65sax6FVoNo2UTlJ0x%2Fuploads%2FVdoF1m5CKJb1oRHIwGzj%2Fimage.png?alt=media&amp;token=e507f8bc-f689-4158-9c1f-995cb26ac7ec" alt=""><figcaption><p>Sum summary of a Variable with a Dimension</p></figcaption></figure>

{% hint style="info" %}
Note, when you apply Dimensions to a Variable, Models will try to apply the most appropriate type of Summary automatically for you, so most of the time you will not need to manually set one yourself.
{% endhint %}

The following Row Summary types are available:

<table><thead><tr><th width="237">Row Summary type</th><th>Details</th></tr></thead><tbody><tr><td><code>None</code></td><td>No summary applied</td></tr><tr><td><code>Sum</code></td><td>Sum of all row values</td></tr><tr><td><code>Auto</code></td><td>Applies calculation of Variable (see details <a href="#auto-row-summary"><strong>below</strong></a>)</td></tr><tr><td><code>Rearranged</code></td><td>Calculates value based on parent Variables (see details <a href="#rearranged-row-summary"><strong>below</strong></a>)</td></tr></tbody></table>

A `Sum` Row Summary is commonly the desired output, but there are situations where a Sum total of rows is not a meaningful calculation, in which case you should choose between an `Auto` or `Rearranged` Summary.

### Auto Row Summary

An `Auto` Row Summary is only available for **Calculation** Variables. In this case, the Summary is calculated by applying the default Calculation of the Variable to the Row Summary lines of the referenced Variables.

> For instance, if the Variable's Calculation is `Profit Margin = Profit / Revenues` across several items, a Sum of Profit Margin is not meaningful. In this case, a useful Summary is to apply the calculation `Profit / Revenues` to the summary line of `Profit` and `Revenues`.

{% hint style="warning" %}
An Auto Row Summary will only work successfully if all referenced Variables have a Summary row themselves (or do not have a Dimension applied)
{% endhint %}

### Rearranged Row Summary

A `Rearranged` Row Summary is used when a meaningful summary value depends on the Variable parents' values.

To apply a Rearranged Summary, we select the `Rearranged` option, and then select the parent Variable which we would like to rearrange.

> For instance, if we have a Variable `Price`, across the `Membership Tier` Dimension (`Basic,` `Premium,` `Platinum)`, a meaningful summary output is the weighted average price across all tiers.
>
> Elsewhere in the Model, we calculate `Revenues = Price * Customers`.&#x20;
>
> In the Summary step of the Variables wizard, we select `Rearranged` and then choose `Revenues` as the rearranged parent. Models then calculates the weighted average price as `Price = Revenues / Customers`, based on the Calculation of the `Revenues` Variable.

<figure><img src="https://2847533834-files.gitbook.io/~/files/v0/b/gitbook-x-prod.appspot.com/o/spaces%2FVy65sax6FVoNo2UTlJ0x%2Fuploads%2FGeW3skuMH9xZqLepP9rA%2Fimage.png?alt=media&amp;token=254e3032-091d-4fa5-8605-d327e888b800" alt="Screenshot showing Summary page of the Variable wizard, with a rearranged summary selected" width="563"><figcaption><p>Rearranged Summary example</p></figcaption></figure>

## Column Summary

A **Column** Summary generates a value for a Variable based on all periods of the Model.

Column Summaries can be applied to all Variables and any number of Column Summaries can be added.

The following Column Summary types are available:

<table><thead><tr><th width="246">Column Summary type</th><th>Details</th></tr></thead><tbody><tr><td>Total</td><td>Sum of values across all periods</td></tr><tr><td>Average</td><td>Mean average of values across all periods</td></tr><tr><td>Min</td><td>Minimum value across all periods</td></tr><tr><td>Max</td><td>Maximum value across all periods</td></tr><tr><td>Last</td><td>Value at last period</td></tr><tr><td>CAGR</td><td>Compound Annual Growth Rate across all periods</td></tr></tbody></table>

Additional options:

* A specific [**Number Format**](/number-formats/number-formats) can be selected for each Column Summary.
* A divisor can be applied, to make the output smaller. Options are: `None`, `Thousands`, `Millions`, `Billions`, `Trillions`

## Multiple Summary Editing

The Summaries of multiple Variables can be edited simultaneously by selecting the Variables and clicking the **Edit Summaries** button in the Variables context menu.

<figure><img src="https://2847533834-files.gitbook.io/~/files/v0/b/gitbook-x-prod.appspot.com/o/spaces%2FVy65sax6FVoNo2UTlJ0x%2Fuploads%2FkzaUVyOvthg1hTZoRrHf%2Fimage.png?alt=media&amp;token=1078dc24-9844-4b34-8b93-4861a426d841" alt="The Edit Summaries button" width="496"><figcaption><p>Edit summaries button</p></figcaption></figure>

The `Rearranged` Summary option will not be available if edited multiple Variables at once.


# Default Assumptions

How to use a Default Assumption to replace missing Assumptions

## Overview

You do not have to specify every [**Assumption**](/assumptions/introduction-to-assumptions) of an Assumption [**Variable**](/variables/variable-basics). For instance, you might have a Variable called `One-off costs`, as in the screenshot below. There are 20 periods in our [**Model**](/models/home-tab), but we only want to enter Assumptions for two of those periods, March and December 2025.

In this case, we can use a Default Assumption to provide a value for the other periods. The screenshot below shows that we have only selected 2 Assumptions in the [**Time Segment**](/variables/time-segments) <mark style="color:green;">**(1)**</mark>, but no warning is shown because we have added a Default Assumption that provides a value of `0` for any period without an Assumption.

<figure><img src="https://2847533834-files.gitbook.io/~/files/v0/b/gitbook-x-prod.appspot.com/o/spaces%2FVy65sax6FVoNo2UTlJ0x%2Fuploads%2FOxKohMWOwON4boSbmZzd%2Fimage.png?alt=media&amp;token=5f834777-6bf0-442d-87c8-adea68b644b2" alt="" width="563"><figcaption><p>Variable using Default Assumption</p></figcaption></figure>

## Adding a Default Assumption

To add a Default Assumption, perform the following steps, as illustrated in the screenshots below.

* In the **Variable dialog**, navigate to the **Default assumption step** <mark style="color:green;">**(1)**</mark> (this will only be shown if `Assumption` Variable type is selected in the **Name and Setup step**
* If your Default Assumption does not already exist, ensure that the **Item statuses** table has its only cell selected <mark style="color:green;">**(2)**</mark>
* Click the **New** button <mark style="color:green;">**(3)**</mark>, which will open an [**Assumptions dialog**](/assumptions/assumptions-wizard) <mark style="color:green;">**(4)**</mark> in which to create the Default Assumption
* Enter any details and the value of the Assumption, click **Finish**, and the Assumption will be selected

<figure><img src="https://2847533834-files.gitbook.io/~/files/v0/b/gitbook-x-prod.appspot.com/o/spaces%2FVy65sax6FVoNo2UTlJ0x%2Fuploads%2FfIQ8RrbO6ocjmIUd71g0%2Fimage.png?alt=media&amp;token=1c7f2669-81b5-4cbc-8b2f-322f6b539392" alt=""><figcaption><p>Adding a Default Assumption</p></figcaption></figure>


# Introduction to Units

How do Units help us build better Models?

When we build models in Excel, we often use units only as an afterthought. Maybe we add a column in which we write a `$` symbol to indicate that a line is in US Dollars. But this is only done as a hint to the spreadsheet user and has no direct impact on any calculations.

In [**Models**](/models/home-tab)**,** Units are built into the fundamental workings of the software. Each [**Variable**](/variables/variable-basics) has a Unit, and if a [**Calculation**](/calculations/introduction-to-calculations) produces an inconsistent Unit, you will see a warning, letting you know that there may be a logical error in your Model.

Units in Models also allow you to automatically move between items of different size, e.g. $ to $000 to $m, (see [**Factors**](/units/key-unit-concepts#factors)).

Units also enable much of the advanced functionality in Models, such as:

* Automatically [**matching Assumptions**](/assumptions/creating-referencing-assumptions#time-segment-editing) to Variables.
* [**Aggregation**](/aggregation/introduction-to-aggregation) of multiple Variables
* Performing automatic and custom Dimension [**references**](/calculations/calculation-parts/variable-references/referencing-dimensions) in Calculations

{% hint style="info" %}
For the most part, you don't *have* to use Units to produce a working Model. Inconsistent Units will only produce warnings, not errors, and calculations will still be performed. And if you want to, you can create a Model with only `Unitless` Variables.

The Models UI is designed to make the use of Units as easy as possible, and to add only a small overhead to your build process.

We hope that once you understand how Units work, it will help you build better, more-readable Models, with fewer errors.
{% endhint %}


# Key Unit Concepts

Understanding Units

## &#x20;Calculation Consistency

Units allow you to ensure that [**Calculations** ](/calculations/introduction-to-calculations)are consistent.

As a simple example, it is logically incorrect to sum together two [**Variables**](/variables/variable-basics) which have a different unit.&#x20;

> Adding a Variable in `GBP` to a Variable in `USD` has no real meaning. If you attempt to do this, Models will warn you that it cannot determine the resulting Unit, which will prompt you to correct the Calculation. One of the two Variables should first be converted to the other currency, before summing, using an exchange rate Variable, with Unit `GBP/USD` or vice versa.

Non-additive operations, such as multiplication, transform Units.

> Multiplying an exchange rate with Unit `GBP/USD` by a Variable with Unit `USD` results in a Variable with Unit `GBP`.
>
> Squaring a Variable will raise the Unit to a power of 2: e.g., Distance in `metre` multiplied by itself will result in a Variable with Unit `metre^2`

Models will automatically derive the Units of your Calculations and tell you the resulting Unit, or display a warning if the Unit is not as expected.

## Units and Tags

Just like [**Dimensions**](/dimensions/introduction-to-dimensions) and other Taglo concepts, Units are based on [**Tags**](/tags/introduction-to-tags). Each Unit component (e.g. GBP, USD, metre) is itself an [**Abstract Tag**](https://help.taglo.io/units/pages/xKXxhPqflNveH4QpWCHU#abstract-vs.-concrete).

When you create a new type of Unit, you simply create a new Abstract Tag.

Use the Short Name property of a Tag to determine how the Tag will be displayed within a Unit (e.g., the `metre` Tag has a Short Name of `m`).

{% hint style="info" %}
Commonly used Units like currencies, units of time, and units of distance can be found in the built-in [**Namespaces**](/using-taglo-software/namespaces).
{% endhint %}

### Inheritance

{% hint style="warning" %}
Unit inheritance analysis is available from Version 0.1.4.0 of Models
{% endhint %}

Because Units are based on Tags, they have access to all of the relationships you have created between Tags. This allows Models to make more intelligent inferences about the output Unit of a Calculation.

> For instance, if you have a Variable with Unit `Apple`, and a second Variable with Unit `Banana`, you should not ordinarily sum these Variables together, as explained [**above**](#calculation-consistency), and Models will warn you about it if you do.
>
> However, if the `Apple` and `Banana` Tags both have a third tag, `Fruit` as a common parent Tag, Models can infer that the Calculation is adding `Fruit` together, rather than Apples and Bananas, resulting in an output Unit of `Fruit`.

The above example will be represented in the Variable view as in the screenshot below. When a Variable is reliant on inheritance to calculate or correctly match its Unit, as is the case for Total Fruit below, Models will show a warning <mark style="color:green;">**(1)**</mark>, in the Variable.

<figure><img src="https://2847533834-files.gitbook.io/~/files/v0/b/gitbook-x-prod.appspot.com/o/spaces%2FVy65sax6FVoNo2UTlJ0x%2Fuploads%2FT3r9IrvqFHxC2sERqMlb%2Fimage.png?alt=media&amp;token=5a93194f-880f-4794-b206-f613632d13e1" alt="Screenshot showing an example of Unit inheritance. There are three Variables: Bananas, Apples, and Total Fruit. Total Fruit is a parent of the Apples and Bananas Variables. The Total Fruit Variable has a visual warning that its Unit is only valid because its calculation components have a common ancestor."><figcaption><p>Unit inheritance example</p></figcaption></figure>

#### Disabling Inheritance

Unit inheritance can be enabled/disabled in the [**Model settings**](/models/model-editor#model-settings-bar) wizard, as shown below. Open the settings wizard from the Model Settings bar, and select or deselect the **Allow Unit inheritance** option <mark style="color:green;">**(1)**</mark> as required.

<figure><img src="https://2847533834-files.gitbook.io/~/files/v0/b/gitbook-x-prod.appspot.com/o/spaces%2FVy65sax6FVoNo2UTlJ0x%2Fuploads%2F0r78khUdB0qg5UkGdkn7%2Fimage.png?alt=media&amp;token=0444e484-ed18-4084-8619-d9bfbab38718" alt="Screenshot of the Model Settings dialog, highlighting the option to Allow Unit Inheritance"><figcaption><p>The Allow Unit Inheritance setting</p></figcaption></figure>

## Compound Units

Many Units are Compound Units: for example, the exchange rate `GBP/USD`. In Taglo, we refer to each component of the Unit as a **Unit Part**.&#x20;

{% hint style="info" %}
In this example, the `USD` Unit Part has an **Order** of `-1`, making it the denominator of the Unit.
{% endhint %}

In the next section, [**Advanced Units**](#advanced-units), you will learn how editing each Unit Part adds functionality to Taglo software.

## Summary

Units help you achieve logical consistency in your calculations. Models allows you to add extra time and contextual detail to your Units, which provide useful information about how the [**Variables**](/variables/variable-basics) and [**Assumptions**](/assumptions/introduction-to-assumptions) in your Model should be treated.

As you read more about working in Models, you will see how these concepts are used to enable powerful functionality.

> For instance, [**Dimensions**](/dimensions/introduction-to-dimensions) work by automatically applying context Tags to the underlying Unit of a Variable.&#x20;

Read on to learn how to create Units.


# Advanced Units

How to use Units to describe additional information

## Overview

In addition to the the straightforward examples on the [**previous page**](/units/key-unit-concepts), Models applies factors, and concepts of time and context to Unit Parts.

## Unit Factors

It is common for models to change between different "sizes" of unit.

> For instance, a financial model for a large company may have a "standard monetary unit" of $000. This means that, unless otherwise specified, all monetary figures are in thousands of US dollars.
>
> Some Variables may need to be specified in a different unit, e.g. the price of a product may be in single US dollars ($).

Unit Factors in Models allows you to move between different factors within the same Model, without needing to specify different versions of the same Unit.

Read more about how to use Unit Factors [**here**](/units/unit-factors).

## Balance vs. Flow

The concepts of Balances and Flows are commonly used in financial modelling (you may also have seen the term Stock used instead of Balance).

> An example of a **Flow** is my annual wages - how much money I have coming in each year. A **Balance** is the amount of money I have in my bank account.

A Flow must relate to a *period* of time (e.g. a day, month or year), whereas a Balance is a snapshot at a *point* in time.

In Models, this concept is captured within a Variable's Unit, which allows Models to infer more context about a calculation. Models applies the following rules:

* Adding a `Balance` to a `Balance` gives another `Balance`
* Adding a `Flow` to a `Balance` gives a `Balance` at a later point in time (see [**Time Offsets**](#time-offsets))
* Adding a `Flow` to a `Flow` gives another `Flow`

## Time and Time Offsets

Units also hold information about time.

> Imagine you want to calculate the number of members who leave your gym business each year (called `Churn`), you would do this by applying a `Churn rate` to the number of customers at the end of the previous year: `Churn = Members [-1] * Churn rate`.
>
> Now let's say I have an [**Assumption**](/assumptions/introduction-to-assumptions) representing actual churn rate in 2021. The Unit for that Assumption would be `Member [Flow, 2021] / Member [Balance, 2020]`. &#x20;
>
> Without these details in the Unit, we would probably label our Assumption as `Unitless, 2021`, which would exclude important information about the assumption and pose several questions: Does 2021 relate to the churned customers, or the starting balance?; What is being churned?; Is the Assumption a Flow or a Balance? (*answer: it is a combination of the two*).
>
> Including time information in the Unit answers these questions in a concise format.

When creating the Unit for a Variable, it is rare to use specific dates - each Unit Part has a **Time Offset** defined, such as `This Period`, or `Offset [-1]`. Any Assumptions created for this Variable will then have specific dates applied to their Unit based on the Timings of the Model. See the [**next section**](/units/defining-a-unit) for more details on defining Units.

## Constants

Units can also be defined as Constant, either as `Constant (Flow)`, or `Constant (Balance)`, to indicate values that are unchanging over time.

## Context (Unit Modifiers)

Just as we add information about Time to Unit Parts, we can also add information about Context by using [**Concrete Tags**](https://help.taglo.io/units/pages/xKXxhPqflNveH4QpWCHU#abstract-vs.-concrete).

Context Tags act as a *modifier* to the main Abstract Tag of the Unit part.

> For instance, if we have a data point representing the population of the United Kingdom at the end of 2022, we would give it the Unit `Person [Balance, 2022, UK]` where `UK` is the Tag for the United Kingdom.
>
> Taglo interprets this Unit as `Person relating to the UK [Balance, 2022]`.

This allows Taglo to infer relationships between different data points based on their Units.

> For instance, let's say we have the following data points: `Person [2020, UK]`, `Person [2021, UK]`, `Person [2022, UK]`, `Person [2021, France]`, `Person [2021, Spain]`(all `Balance` Units).
>
> In this case, Taglo can identify two series from this data: 1) the UK population, changing over time from 2020 to 2022; 2) The population in 2021 of three countries, the UK, France and Spain. It can identify the second series by virtue of the fact that the `UK`, `France`, and `Spain` Tags all have `Country` as a parent.

This method of applying Context to Units avoids the completion of multiple bespoke fields when entering data. You don't need to define a `time` field, or a `country` field - just include the Time and Context in the Unit.

This is particularly powerful for [**Compound Units**](#compound-units), where the Context of one Unit Part might be different from another.

> For instance, I might have data representing the ratio of one country's GDP to another, in `USD`. e.g., `USD [UK] / USD [USA]`, and `USD [France] / USD [USA]`.&#x20;
>
> Normally, I might choose to call these data points *Ratio of GDP to USA GDP*, and then include a `Country` field for the country I'm comparing (`UK` or `France)`.&#x20;
>
> But what happens if I introduce a third data point, `USD [France] / USD [UK]` to my dataset?&#x20;
>
> I would have to call it *Ratio of GDP to UK GDP.* The information about the country I'm comparing France to is hidden in text, and software can't infer a relationship about the two France ratios (one to the USA, and one to the UK).
>
> One solution is to have two extra fields: `Compared country` and `Compare To country`. It doesn't take too much imagination to see that this could soon become unmanageable, and more importantly, not useful. By adding Context to Unit Parts, we take care of this problem.


# Defining a Unit

How to create and edit Units

<figure><img src="https://2847533834-files.gitbook.io/~/files/v0/b/gitbook-x-prod.appspot.com/o/spaces%2FVy65sax6FVoNo2UTlJ0x%2Fuploads%2FqoiSMv4LgPH0WB0vbUbq%2Fimage.png?alt=media&amp;token=b813f8e7-d2a8-4e83-9fb6-92ce74f7cbfe" alt="Screenshot of the Unit step of the Variable dialog"><figcaption><p>Unit step of the Variable wizard</p></figcaption></figure>

{% hint style="info" %}
If this is your first time defining a Unit, we recommend reading the [**Introduction to Units**](/units/introduction-to-units) first
{% endhint %}

You will most commonly define [**Units**](/units/introduction-to-units) as part of the [**Variable wizard**](/variables/variable-basics/unit-and-calculations). You will only need to define a Unit if your Variable is an `Assumptions` Variable, or if you select the `Specify Unit` option for a `Calculation` Variable.

The Unit step is simply a list of [**Unit Parts**](/units/key-unit-concepts#compound-units), in a standard [**List View**](/using-taglo-software/the-taglo-interface/list-views), in which you can *Add*, *Edit* and *Duplicate* Unit Parts. The resulting Unit is shown as a formula at the top of the step.

Each Unit Part can be edited in a separate wizard, or specific properties can be edited individually by clicking on one of the shortcut buttons displayed.

<details>

<summary>Shortcut buttons (as per above image)</summary>

* <img src="https://2847533834-files.gitbook.io/~/files/v0/b/gitbook-x-prod.appspot.com/o/spaces%2FVy65sax6FVoNo2UTlJ0x%2Fuploads%2FxXUWB7PYHNLf5tIDPQSO%2Fimage.png?alt=media&amp;token=0fd6a507-11fa-421b-913c-3aa7eb2c278d" alt="" data-size="line">Change the base [**Tag**](/tags/introduction-to-tags) and/or [**Unit Factor**](/units/advanced-units#factors)
* <img src="https://2847533834-files.gitbook.io/~/files/v0/b/gitbook-x-prod.appspot.com/o/spaces%2FVy65sax6FVoNo2UTlJ0x%2Fuploads%2FiZ2DBLfhFIwqg74sZsBb%2Fimage.png?alt=media&amp;token=493dd7f3-485c-4e69-838e-5ad24c364b48" alt="" data-size="line">Change the Order
* <img src="https://2847533834-files.gitbook.io/~/files/v0/b/gitbook-x-prod.appspot.com/o/spaces%2FVy65sax6FVoNo2UTlJ0x%2Fuploads%2FZB3NsSZNwd5btBWZ4d8F%2Fimage.png?alt=media&amp;token=d86fd46b-1675-4d89-b1d2-c9ebe264faf6" alt="" data-size="line">Change the Time Type (`Flow`, `Balance`, `Flow (Constant)`, `Balance (Constant)`
* <img src="https://2847533834-files.gitbook.io/~/files/v0/b/gitbook-x-prod.appspot.com/o/spaces%2FVy65sax6FVoNo2UTlJ0x%2Fuploads%2F8lf1qcvwkpF1IQPuRiN3%2Fimage.png?alt=media&amp;token=5ce65062-d9fd-4f74-b554-05a5f0c16130" alt="" data-size="line">`Change the Time Offset`
* <img src="https://2847533834-files.gitbook.io/~/files/v0/b/gitbook-x-prod.appspot.com/o/spaces%2FVy65sax6FVoNo2UTlJ0x%2Fuploads%2FEN2B4zBfArqAPQDUjmfT%2Fimage.png?alt=media&amp;token=497d866d-62b2-4e7f-995d-06e9486f029e" alt="" data-size="line">`Add a Context modifier`
* <img src="https://2847533834-files.gitbook.io/~/files/v0/b/gitbook-x-prod.appspot.com/o/spaces%2FVy65sax6FVoNo2UTlJ0x%2Fuploads%2F82Y86mKV5DzLXBlJoa30%2Fimage.png?alt=media&amp;token=3c4f76fc-2c58-4251-ad50-7d61f4add2c2" alt="" data-size="line">Multiply the Order by -1
* <img src="https://2847533834-files.gitbook.io/~/files/v0/b/gitbook-x-prod.appspot.com/o/spaces%2FVy65sax6FVoNo2UTlJ0x%2Fuploads%2FVHPIXoYXIByxlHUf7Og3%2Fimage.png?alt=media&amp;token=a70b4c66-fc50-41e3-a5df-3e14994f027e" alt="" data-size="line">Make a copy of the Unit Part

</details>

{% hint style="info" %}
Functionality of the Unit step depends on the context. You will find additional options if your Variable has [**Dimensions**](/dimensions/introduction-to-dimensions), or if you are creating a [**Data Point**](/assumptions/assumptions-wizard/linking-to-external-data) from scratch.

These differences are covered in the relevant sections of documentation.
{% endhint %}

## Default Unit

You can set a default Unit for new Variables by navigating to [**Model Settings**](/models/model-editor#model-settings)**.**


# Unit Factors

How to move between different "sizes" of Unit

## Overview

It is common for models to change between different "sizes" of unit.

> For instance, a financial model for a large company may have a "standard monetary unit" of $000. This means that, unless otherwise specified, all monetary figures are in thousands of US dollars.
>
> Some Variables may need to be specified in a different unit, e.g. the price of a product may be in single US dollars ($).

Unit Factors in Models allows you to move between different factors within the same Model, without needing to specify different versions of the same Unit.

## Defining Unit Factors

Factors are applied to individual Unit Parts. When a Factor has been applied, it will be shown in brackets alongside the unit type, for example `GBP (000)` as shown in the screenshots below.

To edit the Factor, click on the Unit within the Unit Part <mark style="color:green;">**(1)**</mark>, which will bring up a Unit editor popup, within which you should click the "More" button <mark style="color:green;">**(2)**</mark>. This will open a new wizard step in which you can edit both the base Tag of the Unit Part and the Unit Factor <mark style="color:green;">**(3)**</mark>.

<figure><img src="https://2847533834-files.gitbook.io/~/files/v0/b/gitbook-x-prod.appspot.com/o/spaces%2FVy65sax6FVoNo2UTlJ0x%2Fuploads%2FDmxoO5HD1cJuLAWe96vr%2Fimage.png?alt=media&amp;token=fdd97602-9017-463a-8c59-50e9f0425ccd" alt="Screenshot showing the Unit step of a Variable dialog, in which the Unit is currently set to GBP."><figcaption><p>Shortcut to bring up the Unit editor</p></figcaption></figure>

<figure><img src="https://2847533834-files.gitbook.io/~/files/v0/b/gitbook-x-prod.appspot.com/o/spaces%2FVy65sax6FVoNo2UTlJ0x%2Fuploads%2F7HGSlevxZXvGe5b7PpPP%2Fimage.png?alt=media&amp;token=27951897-2fd6-4555-9001-af31224ba42f" alt="Screenshot showing the open Unit editor popup, with the &#x22;More&#x22; button highlighted"><figcaption><p>The "More" button of the Unit editor</p></figcaption></figure>

<figure><img src="https://2847533834-files.gitbook.io/~/files/v0/b/gitbook-x-prod.appspot.com/o/spaces%2FVy65sax6FVoNo2UTlJ0x%2Fuploads%2F04EZrFkVW0N7kBTXFOBV%2Fimage.png?alt=media&amp;token=83b14cb0-864e-46a8-bd98-923ea9891c20" alt="Screenshot showing a Unit Part editing dialog, with the Unit Factor dropdown highlighted."><figcaption><p>Choosing a Unit Factor</p></figcaption></figure>

## Moving between Unit Factors in Calculations

Factors will be assessed by Models when analysing whether [**Calculations**](/calculations/introduction-to-calculations) are consistent.

Models will show warnings if:

1. A Calculation produces a factor that is different from that of the specified Unit
2. You try to sum together items with different factors

These warnings, and their remedies, are described in the following sections.

### Factor matching error

The screenshots below show an example of how Models deals with a change in Unit Factors. In this case, we have a Variable, `Total revenues` of Unit `GBP`. A second Variable, `Total Revenues (000s)` <mark style="color:green;">**(1)**</mark>, has a Calculation that simply references the first Variable, but its Unit is in `GBP (000s)`.&#x20;

Models detects that the Calculation Unit (`GBP`) does not match the target Unit of `GBP (000s)`, so shows a warning. Models provides two options: *Apply Factoring?* <mark style="color:green;">**(3)**</mark>, and *Override unit error?* <mark style="color:green;">**(4)**</mark>.

If *Apply Factoring?* is checked, the Calculation is automatically divided by `10^3 = 1000` <mark style="color:green;">**(5)**</mark>, and a tick mark <mark style="color:green;">**(6)**</mark> shows that the Variable Unit is now correct.

{% hint style="warning" %}
Selecting the *`Override unit error?`* option will remove the error, but the calculation will need to be modified manually. We recommend using the automatic factoring where available.
{% endhint %}

<figure><img src="https://2847533834-files.gitbook.io/~/files/v0/b/gitbook-x-prod.appspot.com/o/spaces%2FVy65sax6FVoNo2UTlJ0x%2Fuploads%2FybewjZ15MWTLONEzfdRE%2Fimage.png?alt=media&amp;token=f01c9583-fa70-4851-bc6d-c8ac6b68a47b" alt="Screenshot showing a Variable with a Unit matching error, due to non-matching factors"><figcaption><p>Error before Factoring applied</p></figcaption></figure>

<figure><img src="https://2847533834-files.gitbook.io/~/files/v0/b/gitbook-x-prod.appspot.com/o/spaces%2FVy65sax6FVoNo2UTlJ0x%2Fuploads%2FNICSVMDBjrF9avT6Og98%2Fimage.png?alt=media&amp;token=3ed1b9d9-bff9-49b0-ae2e-8d8c6bbd89e8" alt="Screenshot showing a Variable with automatic Factoring applied"><figcaption><p>Error after Factoring applied</p></figcaption></figure>

### Addition error

The screenshot below shows the result of adding together (or subtracting) items with different Unit Factors. In this case, we have a Variable, `Total Profits` <mark style="color:green;">**(1)**</mark> whose Calculation is `Total Revenues (000s) - Total Costs` <mark style="color:green;">**(2)**</mark>. As `Total Revenues (000s)` has Unit `GBP (000s)` and `Total Costs` has Unit `GBP`, Models is unable to determine the resulting Unit of the Calculation.

<figure><img src="https://2847533834-files.gitbook.io/~/files/v0/b/gitbook-x-prod.appspot.com/o/spaces%2FVy65sax6FVoNo2UTlJ0x%2Fuploads%2F3TRo6ZBzkcqOWfFgCVEN%2Fimage.png?alt=media&amp;token=f5622e1f-5ec3-4bdd-9f72-b78ed0a3185e" alt="Screenshot showing a warning when adding/subtracting Variables of different Unit Factor"><figcaption><p>Error when adding/subtracting Variables with different factors</p></figcaption></figure>

In this case, the options are:

1. Manually edit the Calculation and select the *Override unit error?* option (see warning below)
2. Create a new Variable that converts one of the parts of the Calculation into the correct Factor first before using it in the Calculation (**recommended**).

{% hint style="warning" %}
We strongly encourage you **to use option 2** where possible. This will aid clarity of your Model and help other users understand the flow, while ensuring that you do not make a mistake manually converting between factors.
{% endhint %}


# Introduction to Dimensions

How Dimensions allow us to build Models more efficiently

## Overview

Dimensions allow you to work with a collection of items without having to repeat calculations.

> A Dimension might be:
>
> * **Widget Model** | Model A, Model B, and Model C
>
> or
>
> * **Sales Region** | North, East, West, and South

Dimensions are extremely powerful, time-saving, and improve the quality of your Models.

In the example screenshot below, the `Revenues by membership type` Variable has the `Membership Tier` Dimension applied. The `Membership Tier` has 3 children: `Basic`, `Premium`, `Platinum`.

<figure><img src="https://2847533834-files.gitbook.io/~/files/v0/b/gitbook-x-prod.appspot.com/o/spaces%2FVy65sax6FVoNo2UTlJ0x%2Fuploads%2FwhZ6OuX4GPKvsBXkEGQY%2Fimage.png?alt=media&amp;token=5f7c2b30-8ec9-4da9-9d2c-768c05d00c31" alt=""><figcaption><p>Variable with a Dimension applied</p></figcaption></figure>

The Variable has a single formula, `Gym members * Revenue per member`. The `[Auto]` suffixes in the formula imply that the Calculation is able to automatically reference the appropriate line of the referenced Variables, which both also have the `Membership Tier` Dimension applied.

Using Dimensions, you can replace multiple sets of calculations with a single one, without worrying about copy/paste errors.

## Multiple Dimensions

You can apply as many Dimensions as you like to a Variable.&#x20;

In the example screenshot below, the `Revenues by region and membership type` Variable has two Dimensions applied: `Membership Tier` and `Region`. Models calculates a value for each combination of the children of the two Dimensions, in this case 6 lines in total.

<figure><img src="https://2847533834-files.gitbook.io/~/files/v0/b/gitbook-x-prod.appspot.com/o/spaces%2FVy65sax6FVoNo2UTlJ0x%2Fuploads%2Fj8fclJGHfACXpfT7VKij%2Fimage.png?alt=media&amp;token=47049bbb-a537-43bb-92ca-84282c4406f9" alt=""><figcaption><p>Variable with 2 Dimensions applied</p></figcaption></figure>

## Summarising Dimensions

Models can create summaries of Dimensions easily - you don't need to worry about referencing the correct lines in a Calculation.

In the example screenshot below, we want to show the total Revenues across the `North` and `South` regions from the `Revenues by region and membership type` Variable (see above [**Multiple Dimensions**](#multiple-dimensions) example).

To do this we simply create a new Variable with the `Region` Dimension applied, and reference the `Revenues by region and membership type` Variable. Models does the rest for us automatically.

<figure><img src="https://2847533834-files.gitbook.io/~/files/v0/b/gitbook-x-prod.appspot.com/o/spaces%2FVy65sax6FVoNo2UTlJ0x%2Fuploads%2FVGWEdRtmgOf49V7MJX2i%2Fimage.png?alt=media&amp;token=1df3fa33-3d3f-4c26-9cb1-49c51c3e25cf" alt=""><figcaption><p>Variable summarising a Dimension</p></figcaption></figure>


# Dimension Setup

How to create and edit Dimensions

## Based on Tags

Just like [**Units**](/units/introduction-to-units), Dimensions are based on [**Tags**](/tags/introduction-to-tags). In fact, a Dimension *is* a Tag: an `Abstract` Tag with `Concrete` Children.

> For example, `Sales Region` could be an example of an `Abstract` Tag, which has 4 `Concrete` Tag Children (`North`, `East`, `South`, `West`).

{% hint style="info" %}
For a more detailed explanation of Abstract and Concrete Tags, see [**here**](https://help.taglo.io/dimensions/pages/xKXxhPqflNveH4QpWCHU#abstract-vs.-concrete).
{% endhint %}

## Selecting Dimensions

In the Variable wizard [**Setup Step**](/variables/variable-basics/variable-setup#dimensions), you can select/create/edit any Dimensions to apply to your Variable.

In the example screenshot below, the user is shown a list of Dimensions:

1. By default, the list is filtered to just show Dimensions (`Abstract` Tags) with children <mark style="color:green;">**(1)**</mark>. Remove this filter if you want to search through all Tags.
2. Dimensions that are already used in your Model are indicated with an asterisk, and shown at the top of the list <mark style="color:green;">**(2)**</mark>, for easy access.

<figure><img src="https://2847533834-files.gitbook.io/~/files/v0/b/gitbook-x-prod.appspot.com/o/spaces%2FVy65sax6FVoNo2UTlJ0x%2Fuploads%2FzMsGjvp06CuPnx0ZbXbQ%2Fimage.png?alt=media&amp;token=47d4d806-bf4f-48b1-8e88-37fe7c353914" alt="Screenshot showing the Dimensions step of the Variables wizard"><figcaption><p>Dimension step of the Variable wizard</p></figcaption></figure>

### Selecting repeated Dimensions

You can select the same Dimension multiple times. When you do so, you will be asked to select a [**Tag Property**](/tags/advanced-tags#tag-properties) for each instance of the Dimension, as shown in the screenshot below. Each instance must have a different Tag Property selected - this enables Models to differentiate between the two instances.

<figure><img src="https://2847533834-files.gitbook.io/~/files/v0/b/gitbook-x-prod.appspot.com/o/spaces%2FVy65sax6FVoNo2UTlJ0x%2Fuploads%2FBqd88ToyG0cGGOggs0EN%2Fimage.png?alt=media&amp;token=a8d5026e-3747-4aad-bf20-128a279d46d2" alt="Screenshot showing the Dimensions step of the Variable wizard. Two &#x22;Widget Supplier&#x22; dimensions have been selected - one has had the &#x22;From&#x22; Tag Property applied, and the other has had the &#x22;To&#x22; Tag Property applied."><figcaption><p>Selecting repeated Dimensions</p></figcaption></figure>

To select a Tag Property, click on the dropdown and select from an existing Tag Property, or create a new one, as shown in the screenshot below.

<figure><img src="https://2847533834-files.gitbook.io/~/files/v0/b/gitbook-x-prod.appspot.com/o/spaces%2FVy65sax6FVoNo2UTlJ0x%2Fuploads%2F9jWx08ZDa2EksLPIAAmU%2Fimage.png?alt=media&amp;token=dced80cd-02c6-42da-b67f-1b0530d17189" alt="Screenshot showing the Tag Property dropdown control available when multiple instances of the same Dimension are selected"><figcaption><p>The Tag Property control</p></figcaption></figure>

These Tag Properties will be visible in the Variable preview, and will indicate how the heading of each Variable item should be interpreted.&#x20;

In the below example, the Variable calculates the movement of customers between three suppliers - **from** each of the three suppliers, **to** each of the three suppliers. The titles of each row in Values table <mark style="color:green;">**(2)**</mark> can be interpreted as the "From" supplier followed by the "To" supplier, as indicated by the Dimensions description at <mark style="color:green;">**(1)**</mark>.

<figure><img src="https://2847533834-files.gitbook.io/~/files/v0/b/gitbook-x-prod.appspot.com/o/spaces%2FVy65sax6FVoNo2UTlJ0x%2Fuploads%2F0mWJmcoa6Nwk8MFMCLCX%2Fimage.png?alt=media&amp;token=01e9a6ea-015a-48c0-8a0d-ee98c8efaf22" alt="" width="563"><figcaption><p>Preview of Variable with repeated Dimensions</p></figcaption></figure>

## Creating/Editing Dimensions

To create a Dimension, just add a new item to the list. Choose a name for the Dimension, and the [**Namespace**](/using-taglo-software/namespaces) the Dimension should belong to. By default, the new Dimension will be added to the same Namespace as your Model.

{% hint style="info" %}
When you create a new Dimension, you are actually creating a new `Abstract` [**Tag**](/tags/introduction-to-tags). You can use the Tags Application to manage Tags (and their associated Dimensions) all in one place.
{% endhint %}

As shown below, you can enter new Child names for your Dimension directly into the text box <mark style="color:green;">**(1)**</mark>, and a new `Concrete` Tag will be created for each one. You can edit existing Children by hovering over the Child, and clicking on the Edit Tag <img src="https://2847533834-files.gitbook.io/~/files/v0/b/gitbook-x-prod.appspot.com/o/spaces%2FVy65sax6FVoNo2UTlJ0x%2Fuploads%2FTtTB69OZ3vca2DhdghhW%2Fimage.png?alt=media&amp;token=e7e2226c-68d4-4176-a842-ad66af0d5ecd" alt="" data-size="line">button that appears <mark style="color:green;">**(2)**</mark>. This is where you can edit the Short Name property of the Tag, which is the name that will be displayed when the Child appears in your Model.

<figure><img src="https://2847533834-files.gitbook.io/~/files/v0/b/gitbook-x-prod.appspot.com/o/spaces%2FVy65sax6FVoNo2UTlJ0x%2Fuploads%2FIhxMZtlcZ2sfp8VmpmDM%2Fimage.png?alt=media&amp;token=eb97f1af-145a-4efd-9dcf-245346046bba" alt="Screenshot showing the Dimension editor"><figcaption><p>Editing a Dimension</p></figcaption></figure>


# Defining Unit Variance by Dimension

How to use Dimensions with Units

## Overview

When you use [**Dimensions**](/dimensions/introduction-to-dimensions) in a [**Variable**](/variables/variable-basics), you may need to specify how each part of the Variable's [**Unit**](/units/introduction-to-units) varies.

> For example, in the screenshot below, our Variable has two (repeated) Dimensions replied: 1) Widget Supplier that a customer is moving **from**, and 2) Widget Supplier that a customer is moving **to**.
>
> In this case, the numerator (top) of the Unit refers to the "To" supplier, and the denominator (bottom) refers to the "From" supplier.

The user indicates how the unit parts should vary by using the toggle controls highlighted. This means that Models can correctly infer how to create the Units for [**Assumptions** ](/assumptions/introduction-to-assumptions)and how to correctly reference Variables in [**Calculations**](/calculations/introduction-to-calculations).

<figure><img src="https://2847533834-files.gitbook.io/~/files/v0/b/gitbook-x-prod.appspot.com/o/spaces%2FVy65sax6FVoNo2UTlJ0x%2Fuploads%2FKz0whxP29eNPzZQWx3T5%2Fimage.png?alt=media&amp;token=726a0c94-7fc8-41f9-81ed-155d1f4a06b5" alt="Screenshot showing the Unit step of the Variable wizard, with two &#x22;Widget Supplier&#x22; dimensions applied"><figcaption><p>Selecting Unit Variance with Dimensions</p></figcaption></figure>


# Data Types

Understanding Data Types in Models

## Overview

Models uses seven data types to perform calculations, described in the table below.

<table><thead><tr><th width="173.33333333333331">Data Type</th><th width="319">Description</th><th data-type="content-ref">Link to Microsoft definition</th></tr></thead><tbody><tr><td><code>Double</code></td><td>Double-precision floating point number (Excel default number type)</td><td><a href="https://learn.microsoft.com/en-us/dotnet/api/system.double?view=net-8.0">https://learn.microsoft.com/en-us/dotnet/api/system.double?view=net-8.0</a></td></tr><tr><td><code>Integer</code></td><td>Represents whole numbers from negative to positive 2,147,483,648 (32-bits)</td><td><a href="https://learn.microsoft.com/en-us/dotnet/api/system.int32?view=net-8.0">https://learn.microsoft.com/en-us/dotnet/api/system.int32?view=net-8.0</a></td></tr><tr><td><code>String</code></td><td>Represents a text value</td><td><a href="https://learn.microsoft.com/en-us/dotnet/api/system.string?view=net-8.0">https://learn.microsoft.com/en-us/dotnet/api/system.string?view=net-8.0</a></td></tr><tr><td><code>DateTime</code></td><td>Represents a point in time</td><td><a href="https://learn.microsoft.com/en-us/dotnet/api/system.datetime?view=net-8.0">https://learn.microsoft.com/en-us/dotnet/api/system.datetime?view=net-8.0</a></td></tr><tr><td><code>Date</code></td><td>Represents a specific day</td><td><a href="https://learn.microsoft.com/en-us/dotnet/api/system.dateonly?view=net-8.0">https://learn.microsoft.com/en-us/dotnet/api/system.dateonly?view=net-8.0</a></td></tr><tr><td><code>Boolean</code></td><td>Logical value (TRUE or FALSE)</td><td><a href="https://learn.microsoft.com/en-us/dotnet/api/system.boolean?view=net-8.0">https://learn.microsoft.com/en-us/dotnet/api/system.boolean?view=net-8.0</a></td></tr><tr><td><code>Validation</code></td><td>Represents a value from a list of choices - each value is the Child <a href="broken://tags/introduction-to-tags"><strong>Tag</strong></a> of a <a href="/dimensions/introduction-to-dimensions"><strong>Dimension</strong></a></td><td></td></tr></tbody></table>

The default Data Type for a [**Variable**](/variables/variable-basics) is `Double`.&#x20;

## Conversions

Models calculates values based on the Data Type of each Variable - if you use different Data Types in your Model, values will be converted to the Data Type of their Variable.

> For instance, if you have a Variable with Data Type `Integer`, which performs a Calculation based on two Variables with Data Type `Double`, the calculation will be performed with `Double` types, and then converted to an `Integer` (whole number).

You should bear in mind the following notes on conversions when using multiple Data Types.

<table><thead><tr><th width="177">Data Type</th><th>Conversion notes</th></tr></thead><tbody><tr><td><code>String</code></td><td>Text values cannot be converted to numerical values. An error will be shown.</td></tr><tr><td><code>DateTime</code> and <code>Date</code></td><td>See details below</td></tr><tr><td><code>Boolean</code></td><td><code>TRUE</code> is converted to 1, and <code>FALSE</code> converted to 0 when performing calculations (e.g., 100 * TRUE = 100)</td></tr><tr><td><code>Validation</code></td><td>A <code>Validation</code> value is treated as the text value of the name of its associated Tag</td></tr></tbody></table>

### DateTime/Date treatments

Both `DateTime` and `Date` are treated in the same way as Excel treats Dates (see [**here**](https://support.microsoft.com/en-us/office/datevalue-function-df8b07d4-7761-4a93-bc33-b7471bbff252#:~:text=Excel%20stores%20dates%20as%20sequential,date%20values%20to%20serial%20numbers.)), with 1st January 1900 stored as 1, with each subsequent day increasing the value by 1. Before performing calculations, Models converts Dates to serial numbers to ensure that calculations are performed identically to Excel.

Models treats a `Date` as midnight at the end of the day when converting to `DateTime`.\
\
Note, that Excel has a bug (described [**here**](https://learn.microsoft.com/en-us/office/troubleshoot/excel/wrongly-assumes-1900-is-leap-year)), in which 1900 is incorrectly assumed to be a leap year. Models replicates this bug to ensure consistency with Excel.

## Comparison with Excel

Excel uses a smaller set of Data Types than Models:

* Number
* Text
* Logical (`TRUE` or `FALSE`)
* Error

Excel does not differentiate between `Double` and `Integer` types, so this should be taken into account when generating Excel. You will need to use a rounding function in your Model if you want to force Excel to output an `Integer`.

Dates in Excel are stored as numbers, as described [**above**](#conversions).&#x20;

Excel does not automatically convert Logical values to 1 (`TRUE`) and 0 (`FALSE`).

> For instance, if cells A1 and B1 have values TRUE and FALSE respectively, then A1 + B1 = 1, but SUM(A1, B1) = 0.
>
> Using an equivalent SUM formula in Models would produce the result 1; therefore, it is important, if generating Excel from Models, to check that such calculations produce the desired result.
>
> As a rule of thumb, applying an operator to a `TRUE`/`FALSE` value (e.g. +, \*) ensures that the value is converted to a number.


# Introduction to Assumptions

How Assumptions are used to store Model inputs

## Overview

In [**Models**](/models/home-tab), input values are stored separately from [**Variables**](/variables/variable-basics) and their [**Calculations**](/calculations/introduction-to-calculations).

This allows you to manage the inputs to your Model independently of the calculations within the Model, and to easily create variations on your inputs (through [**Scenarios**](/cases/managing-scenarios) and [**Sensitivities**](/cases/managing-sensitivities)).

This separation means that you can create sets of Assumptions from scratch, without creating the Variables that will reference them, though in practice you will most often generate Assumptions from within a Variable as this is by far the fastest way to do so.

<figure><img src="https://2847533834-files.gitbook.io/~/files/v0/b/gitbook-x-prod.appspot.com/o/spaces%2FVy65sax6FVoNo2UTlJ0x%2Fuploads%2F5liaieFJRCn5cILii0wh%2Fimage.png?alt=media&amp;token=9f13de94-41e3-4498-8e35-c1e31ffc74b2" alt=""><figcaption><p>List of Assumptions in Models</p></figcaption></figure>

## The Assumptions Tab

<figure><img src="https://2847533834-files.gitbook.io/~/files/v0/b/gitbook-x-prod.appspot.com/o/spaces%2FVy65sax6FVoNo2UTlJ0x%2Fuploads%2FJELw38QbpcZa11wpOkkS%2Fimage.png?alt=media&amp;token=c6e48b11-9672-45b2-8ee3-ab95c6866320" alt="Screenshot of the Assumptions tab, with several assumptions selected, showing a preview chart of the values of those assumptions"><figcaption><p>Assumptions List in the Assumptions Tab</p></figcaption></figure>

Keeping Assumptions separate from Variables means you can thoroughly interrogate and quickly edit all inputs to your Model in one place.

You can do this in the Assumptions Tab, where functionality includes (as per the above screenshot):

* Search and Order your Assumptions with Tag filters, text search, property filters and sorting <mark style="color:green;">**(1)**</mark>
* Directly edit Assumption [**Scenario**](/cases/managing-scenarios) values <mark style="color:green;">**(2)**</mark> - just click in a cell, type, and press Enter to save
* Directly edit Assumption [**Sensitivity**](/cases/managing-sensitivities) values <mark style="color:green;">**(3)**</mark>
* Visualise your assumptions in [**Charts**](/charts/introduction-to-charts) - just select any Assumptions that relate to each other, and Models will plot them on a chart which you can configure.

{% hint style="info" %}
Selecting a single Assumption will show you a preview including the details of that Assumptions Unit; Selecting multiple Assumptions will show you a chart (if the selected Assumptions' Units can form a valid series)
{% endhint %}


# Creating/Referencing Assumptions

How to generate new Assumptions and reference them from Variables

## Creating Assumptions from Variables

The easiest way to create new Assumptions, is from the [**Time Segments**](/variables/time-segments) of a [**Variable**](/variables/variable-basics).

Any Time Segment of [**formula type**](/variables/time-segments/time-segment-setup#formula) `Assumptions` will show you how many Assumptions are required for that Time Segment, how many have been selected, and how many are valid.

You will see these indicators in the Time Segment like in the screenshot below.

<figure><img src="https://2847533834-files.gitbook.io/~/files/v0/b/gitbook-x-prod.appspot.com/o/spaces%2FVy65sax6FVoNo2UTlJ0x%2Fuploads%2FRmy5gQR14ZEHiOBkoKE6%2Fimage.png?alt=media&amp;token=9914ead7-c99d-4773-b5a5-f8d713ce3094" alt=""><figcaption><p>A Time Segment with six valid Assumptions</p></figcaption></figure>

When a Time Segment does not have correctly selected Assumptions it will show you a warning, and you will have two options:

1. Use the **Create Missing Assumptions** shortcut (the fastest method)
2. Edit the Time Segment manually

### Create Missing Assumptions shortcut

<figure><img src="https://2847533834-files.gitbook.io/~/files/v0/b/gitbook-x-prod.appspot.com/o/spaces%2FVy65sax6FVoNo2UTlJ0x%2Fuploads%2F5WLud52T8zmL02B6dZ3v%2Fimage.png?alt=media&amp;token=1ab6d9f8-a49e-4ac0-ade4-e86b8ccbf3aa" alt=""><figcaption><p>Time Segment with six missing Assumptions</p></figcaption></figure>

Any Time Segment with missing assumptions will show a **Create Missing Assumptions** <img src="https://2847533834-files.gitbook.io/~/files/v0/b/gitbook-x-prod.appspot.com/o/spaces%2FVy65sax6FVoNo2UTlJ0x%2Fuploads%2Fr7ITOSHtZ0ZcMOme4hi2%2Fimage.png?alt=media&amp;token=c27f2756-bc8b-4adf-9af6-d5a31d14906b" alt="" data-size="line">button, as shown in the screenshot above.

{% hint style="info" %}
In the above example, our Variable has two [**Dimensions**](/dimensions/introduction-to-dimensions) applied, with a total of 6 line items, and the [**Unit**](/units/introduction-to-units) is of [`Constant` **Time Type**](/units/key-unit-concepts#constants), meaning that only one Assumption is required for each item.
{% endhint %}

Pressing **Create Missing Assumptions** will bring up an [**Assumption value entry wizard**](/assumptions/assumptions-wizard/assumption-values-step), in which you can directly enter values. After entering the values and pressing **Finish**, an Assumption will be created for each value and added to the Time Segment.

### Time Segment Editing

You can also Edit the Time Segment directly, in the Time Segment step of the Variable wizard, as in the screenshot below (1).

<figure><img src="https://2847533834-files.gitbook.io/~/files/v0/b/gitbook-x-prod.appspot.com/o/spaces%2FVy65sax6FVoNo2UTlJ0x%2Fuploads%2FCGk5Jos8ppJAPLAmgHzN%2Fimage.png?alt=media&amp;token=723db9ec-2792-4347-b4e5-36007a6bf4f7" alt=""><figcaption><p>Edit Time Segment directly</p></figcaption></figure>

In the **Formula** step of the Time Segment dialog, you can select existing Assumptions for the Time Segment if they have already been created, or create new ones, as per the steps shown in the screenshot below:

1. Use the **Item Status** grid <mark style="color:green;">**(1)**</mark> to select the items that you want to create assumptions for - by default, all items are selected (selected items are indicated by the filter <img src="https://2847533834-files.gitbook.io/~/files/v0/b/gitbook-x-prod.appspot.com/o/spaces%2FVy65sax6FVoNo2UTlJ0x%2Fuploads%2FxOjJlbzD8SrjTdqNziKE%2Fimage.png?alt=media&amp;token=d221bcc0-0b5b-4380-ba9d-2684e1f94d32" alt="" data-size="line"> symbol)
2. Press the **New**<img src="https://2847533834-files.gitbook.io/~/files/v0/b/gitbook-x-prod.appspot.com/o/spaces%2FVy65sax6FVoNo2UTlJ0x%2Fuploads%2FiwsdorlAJKuPo48syzs0%2Fimage.png?alt=media&amp;token=bd14fb53-faeb-4acc-b58f-fe4d91dadf30" alt="" data-size="line"> button <mark style="color:green;">**(2)**</mark>, which will bring up an **Assumptions wizard**, in which you can enter values for the new Assumptions
3. On finishing the Assumptions dialog you will see the newly created Assumptions in the Time Segment wizard <mark style="color:green;">**(3)**</mark>. The Item Status grid <mark style="color:green;">**(4)**</mark> will now show a green background for each item, indicating that a matching Assumption is available.
4. **Select** the newly created Assumptions in the Assumptions list <mark style="color:green;">**(3)**</mark>, and note that each item in the Item Status Grid <mark style="color:green;">**(4)**</mark> now has a tick to indicate that an item has been selected.
5. Click finish

<figure><img src="https://2847533834-files.gitbook.io/~/files/v0/b/gitbook-x-prod.appspot.com/o/spaces%2FVy65sax6FVoNo2UTlJ0x%2Fuploads%2FskDq0H0zxhZxIA5ljUvE%2Fimage.png?alt=media&amp;token=ddb027ff-1301-429b-9f9a-95c2818a753b" alt="Screenshots showing the process of creating and selecting assumptions in the Time Segment wizard"><figcaption><p>Adding Assumptions in the Formula step of the Time Segment wizard</p></figcaption></figure>

## Creating standalone Assumptions

You can create Assumptions without an associated Variable. To do this, go to the **Assumptions** Tab of the Model Editor, and open a [**new Assumptions wizard**](/using-taglo-software/the-taglo-interface/adding-items).

Read on to learn more about the Assumptions Wizard.


# Assumptions Wizard

How to use the Assumptions wizard for adding and editing assumptions

## Setup

<figure><img src="https://2847533834-files.gitbook.io/~/files/v0/b/gitbook-x-prod.appspot.com/o/spaces%2FVy65sax6FVoNo2UTlJ0x%2Fuploads%2FBzBoVW7JFERMzBOG5RGQ%2Fimage.png?alt=media&amp;token=6650e519-410b-4fb3-8851-e9bcd94bb2e5" alt=""><figcaption><p>Setup page of the Assumptions wizard</p></figcaption></figure>

### Name

Enter a name for your Assumption. There are no restrictions to how you name your Assumptions, as long as the name isn't blank.

{% hint style="info" %}
Bear in mind that if you will be generating Excel from your Model, Assumption names will be written in the spreadsheet, meaning you should avoid choosing a name that Excel will interpret as a formula, otherwise you will run into problems.
{% endhint %}

### Value Source

Assumptions can take their value from 3 sources:

<table><thead><tr><th width="237">Value source</th><th>Description</th></tr></thead><tbody><tr><td><code>Local Input</code></td><td>Manually entered values which are stored within the Model, and cannot be shared between Models</td></tr><tr><td><code>External Data</code></td><td>Values which are stored in a separate <a href="/data/introduction-to-data"><strong>Data</strong> </a>application; These values can be used by multiple Models</td></tr><tr><td><code>Link to Plug-In</code></td><td>Values stored in an Excel spreadsheet, which are added to the Model when generating Excel</td></tr></tbody></table>

The Assumptions wizard will update with the relevant steps according to the option chosen here. Instructions for entering data for each type of source can be found at the following locations:

* [**Local Input**](/assumptions/assumptions-wizard/assumption-values-step)
* [**External Data**](/assumptions/assumptions-wizard/linking-to-external-data)
* [**Link to Plug-In**](/assumptions/assumptions-wizard/linking-to-excel-inserts)

{% hint style="info" %}
An Assumption can use different sources for each [**Scenario**](#scenarios) in the Model. e.g. you might link to External Data for the Base Scenario, and then enter Local Input values for alternative Scenarios
{% endhint %}

### Dimensions

Choose any [**Dimensions**](#dimensions) that you want to apply to your Assumptions.

{% hint style="info" %}
When editing multiple existing Assumptions, any Dimensions will be automatically detected and cannot be changed
{% endhint %}

### Number Format

Choose the [**Number Format**](#number-format) to apply to your Assumptions.

### Scenarios

You can enter values for Assumptions for multiple [**Scenarios**](#scenarios) simultaneously. By default, the wizard will prompt you to enter values for the `Base` Scenario only, but you can select multiple Scenarios here, in which case you will need to enter values for all selected Scenarios.

{% hint style="warning" %}
For [**External Data**](/assumptions/assumptions-wizard/linking-to-external-data), you can only select values for one Scenario at a time. If you want to use External Data for multiple Scenarios for the same Assumption, you will need to select Data for each Scenario separately.
{% endhint %}

### Data Type

Choose the [**Data Type**](#data-type) for your Assumptions.

## Unit

You will need to enter a [**Unit**](#unit) for your Assumptions.

[**See here**](/units/defining-a-unit) for more details on how to use the Unit step of the wizard.


# Assumption Dates Step

How to define a Date range for Assumptions

## Overview

<figure><img src="https://2847533834-files.gitbook.io/~/files/v0/b/gitbook-x-prod.appspot.com/o/spaces%2FVy65sax6FVoNo2UTlJ0x%2Fuploads%2FakpUXuFqI9Jd4MNfV3A7%2Fimage.png?alt=media&amp;token=9ed140cd-6ea7-4234-bf68-20b81ef6d15b" alt=""><figcaption><p>The Dates step of the Assumptions wizard</p></figcaption></figure>

If creating new Assumptions manually, you will need to specify a date range for the Assumptions. By default the date range is set to the [**Timings**](/models/home-tab/creating-a-model/timings) of the Model (e.g. one Assumption per period).

If the [**Unit**](/units/introduction-to-units) for your Assumptions is `Constant` (i.e. no part of the Unit varies with time), the Dates step will not be shown.

{% hint style="info" %}
The Dates step will only be shown when creating new Assumptions. If you are editing multiple Assumptions, the time range for the Assumptions will be automatically detected.
{% endhint %}

## Entry type&#x20;

Dates can be entered with an **automatically generated** series of dates, or a **manually entered** list of dates.

Instructions for each of these options are below.

## Date entry

### Automatically generated

#### Start Date / End Date / Number of intervals

Enter the Start date, number of intervals, and End date for the series. The format of date entry depends on the period type of the Model (see details [**here**](/models/home-tab/creating-a-model/timings#start-end-date-text-formats)).

Editing any two of these three inputs will automatically update the third.

#### Intervals between dates

By default, assumptions will be generated for each period between the start date and end date. You can opt to change this interval: e.g., to generate an assumption for every fourth period, you would enter 4.

### Manual batch entry

If you select **Manual batch entry**, you will be presented with a text box in which you can type/paste a list of dates, which must be in the correct format, as shown in the example screenshot below.

You must include a line break in between each date.

<figure><img src="https://2847533834-files.gitbook.io/~/files/v0/b/gitbook-x-prod.appspot.com/o/spaces%2FVy65sax6FVoNo2UTlJ0x%2Fuploads%2FkzWdI3oaOQyV0AyduZjC%2Fimage.png?alt=media&amp;token=0f9c676e-556b-4e2c-a69e-247f3e051a2d" alt="Screenshot of the manual batch entry step used to enter multiple dates for a time series in the Assumptions wizards"><figcaption><p>Manual batch entry of dates in the Assumptions wizard</p></figcaption></figure>


# Assumption Values Step

How to enter values for Assumptions

## Overview

<figure><img src="https://2847533834-files.gitbook.io/~/files/v0/b/gitbook-x-prod.appspot.com/o/spaces%2FVy65sax6FVoNo2UTlJ0x%2Fuploads%2FbDoCQ4bXRk16SPRhzrvr%2Fimage.png?alt=media&amp;token=a4bb6eb5-2cb2-4fb6-a318-28e6cbe5df4e" alt="Screenshot showing the Assumptions Values step of the Assumptions dialog. The user is presented with a table in which they should enter values for the assumptions. 5 of the values have been entered correctly, indicated by cell formatting in the table. The last value is yet to be entered and its cell has a pink background indicating that it is not valid." width="563"><figcaption><p>Values step of the Assumptions wizard</p></figcaption></figure>

When creating Assumptions, either through the Assumptions wizard or [**from a Variable**](/assumptions/creating-referencing-assumptions#creating-assumptions-from-variables), you will usually enter values through the Values step interface.

This presents you with a table in which you can enter a value for each Assumption. Validity of the entered data is indicated by a green/red background.

## Dimension editing

<figure><img src="https://2847533834-files.gitbook.io/~/files/v0/b/gitbook-x-prod.appspot.com/o/spaces%2FVy65sax6FVoNo2UTlJ0x%2Fuploads%2F0eI6P36QmnMMsZUfhY8f%2Fimage.png?alt=media&amp;token=7f84fbd3-7fc4-4e77-9ee6-4d3f4d6de81d" alt=""><figcaption><p>Dimension editing interface</p></figcaption></figure>

The **Dimension editing** section of the interface allows you to rearrange the order and positioning of items in the value entry table.

Drag and drop the table dimensions (Time, Scenarios, Dimensions) between the Horizontal and Vertical sections to change the way in which the table is displayed.

You can sort each dimension by pressing the <img src="https://2847533834-files.gitbook.io/~/files/v0/b/gitbook-x-prod.appspot.com/o/spaces%2FVy65sax6FVoNo2UTlJ0x%2Fuploads%2FLkMlCOEtufW6DvQ80ai8%2Fimage.png?alt=media&amp;token=26e2558e-3f9a-44af-af8b-97619a4d1eea" alt="" data-size="line">sort button and selecting a sort direction.

In the example below, the interface shown in the [**Overview**](#overview) section above is rearranged with the `Region` dimension horizontal, and the `Membership Tier` sorted alphabetically.

<figure><img src="https://2847533834-files.gitbook.io/~/files/v0/b/gitbook-x-prod.appspot.com/o/spaces%2FVy65sax6FVoNo2UTlJ0x%2Fuploads%2FxT0DkQz4aBKZ6jf1Ggxu%2Fimage.png?alt=media&amp;token=f7795e70-635b-4be4-82ac-64ece6aca511" alt="Screenshot of the Assumption Values entry interface. The dimensions of the assumptions have been rearranged so that the table is in a 3x2 format rather than a 6x1 format. The Membership Tier dimension has been sorted alphabetically." width="563"><figcaption><p>Value entry with rearranged and sorted dimensions</p></figcaption></figure>

{% hint style="info" %}
Much of the time you won't need to rearrange the value entry dimensions, but it can help enormously when you are working with a large number of Assumptions.

e.g., if you are entering data across a large number of periods, we recommend moving `Time` to Vertical
{% endhint %}

## Copy/Paste

The value entry interface includes some functions to make it easier to copy and paste values to and from Excel, or other spreadsheets.

<table><thead><tr><th width="218">Button</th><th>Details</th></tr></thead><tbody><tr><td><img src="https://2847533834-files.gitbook.io/~/files/v0/b/gitbook-x-prod.appspot.com/o/spaces%2FVy65sax6FVoNo2UTlJ0x%2Fuploads%2F11WFgmO7w43CELZBobxr%2Fimage.png?alt=media&amp;token=6e5f27a1-fd9a-4bc2-adff-46ac0a9335e7" alt="Paste Values button" data-size="line"></td><td>Pastes contents of clipboard to table if possible. If pasting several values from Excel, will paste from first cell in the table. Pasting will not work if the number and position of copied values do not match the cells in the table.</td></tr><tr><td><img src="https://2847533834-files.gitbook.io/~/files/v0/b/gitbook-x-prod.appspot.com/o/spaces%2FVy65sax6FVoNo2UTlJ0x%2Fuploads%2F24mnJVexqYj9KAxBIhy6%2Fimage.png?alt=media&amp;token=fbecbbfe-5391-4fa3-81c0-038d62aa003b" alt="Copy values to clipboard button" data-size="line"></td><td>Copies just the value cells to the clipboard. If pasted to Excel, will paste in the same layout.</td></tr><tr><td><img src="https://2847533834-files.gitbook.io/~/files/v0/b/gitbook-x-prod.appspot.com/o/spaces%2FVy65sax6FVoNo2UTlJ0x%2Fuploads%2FZYKodEsNHPJy1Dl50nwv%2Fimage.png?alt=media&amp;token=dc8870e3-2122-4cc5-95dd-886af5112d25" alt="Copy all to clipboard button" data-size="line"></td><td>Copies value cells and row/column headers to the clipboard. If pasted to Excel, will paste in the same layout.</td></tr></tbody></table>

You can also paste in values using the `Ctrl+V` shortcut. If you have copied multiple values (e.g. from Excel), values will start to be pasted from the currently selected cell.

{% hint style="info" %}
For a large number of assumptions, we sometimes find it easiest to use **Copy all to clipboard**  to paste the entry table into Excel, edit values in Excel, and paste back to Models using **Paste Values** or **`Ctrl+V`.**
{% endhint %}

{% hint style="info" %}
If pasting values from Excel, use [**Dimension editing**](#dimension-editing) to make the values entry layout match the layout of your data in Excel before pasting.
{% endhint %}


# Linking to external Data

How to link Assumptions to external Data points

## Overview

[**Models**](/models/home-tab) includes an application for managing commonly used [**Data**](/data/introduction-to-data), leveraging the power of [**Units**](/units/introduction-to-units) and [**Tags**](/tags/introduction-to-tags).&#x20;

Model Assumptions can link to this Data, which provides benefits over entering the data manually within the Model:

* Values stored in Data are linked to a [**Data Source**](/data/data-sources) (a document or URL), which can be instantly opened from Models to quickly understand where values originate
* Values stored in Data can be reused across multiple Models

{% hint style="info" %}
Read more about how to create and manage Data [**here**](/data/introduction-to-data).
{% endhint %}

## External Data Step

<figure><img src="https://2847533834-files.gitbook.io/~/files/v0/b/gitbook-x-prod.appspot.com/o/spaces%2FVy65sax6FVoNo2UTlJ0x%2Fuploads%2FTc9DIj3epHRuZREujFxd%2Fimage.png?alt=media&amp;token=060e95ed-4c1e-4abe-8e4a-a87d89880936" alt="Screenshot of the External Data page of the Assumptions wizard." width="563"><figcaption><p>External Data step of the Assumptions wizard</p></figcaption></figure>

From the Assumptions wizard, you can select and create new Data from which to take values.

The **External Data** page presents you with a list of Data in available [**Namespaces**](/using-taglo-software/namespaces) and an **Item Status** control.

In the Item Status control, you can:

* **See whether Data is available** **for your Assumptions** - a <mark style="color:green;">**green**</mark> background indicates that one or more Data points are available
* **See when Data is selected** - a <img src="https://2847533834-files.gitbook.io/~/files/v0/b/gitbook-x-prod.appspot.com/o/spaces%2FVy65sax6FVoNo2UTlJ0x%2Fuploads%2FBnSBM4fNp5tdCeDkD3n9%2Fimage.png?alt=media&amp;token=f045d3df-4521-4ffb-a3bf-d51af07e1078" alt="" data-size="line"> tick indicates whether an item has been selected
* **Filter the list of Data to matching Units** - a <img src="https://2847533834-files.gitbook.io/~/files/v0/b/gitbook-x-prod.appspot.com/o/spaces%2FVy65sax6FVoNo2UTlJ0x%2Fuploads%2FiwyTqzMhTC4SWtBQzUgf%2Fimage.png?alt=media&amp;token=c94c6a1b-1472-470d-a34e-dc8100dcbbec" alt="" data-size="line"> filter symbol indicates when an Assumption is an active filter - click on any cell or heading in the table to change the active filters (by default, all cells are active filters)

If no matching Data is present, you can create new Data in the Data list, which will bring up a new **Data wizard**. Read more about the [**Data wizard here**](/data/creating-data). The wizard will be configured according to the filters set in the Item Status control.

> For instance, in the example screenshot above, if all three cells are set as active filters, creating new Data will open a dialog with the correct Unit and Dimensions pre-populated for the three `Monthly Price per Member` assumptions.

On closing the Data wizard, new Data will have been added to the list and selected.

{% hint style="warning" %}
When creating new Data, it is often faster to enter local values first, then convert them to Data, as described in the section [**below**](#converting-local-values-to-data)
{% endhint %}

## Converting Local Values to Data
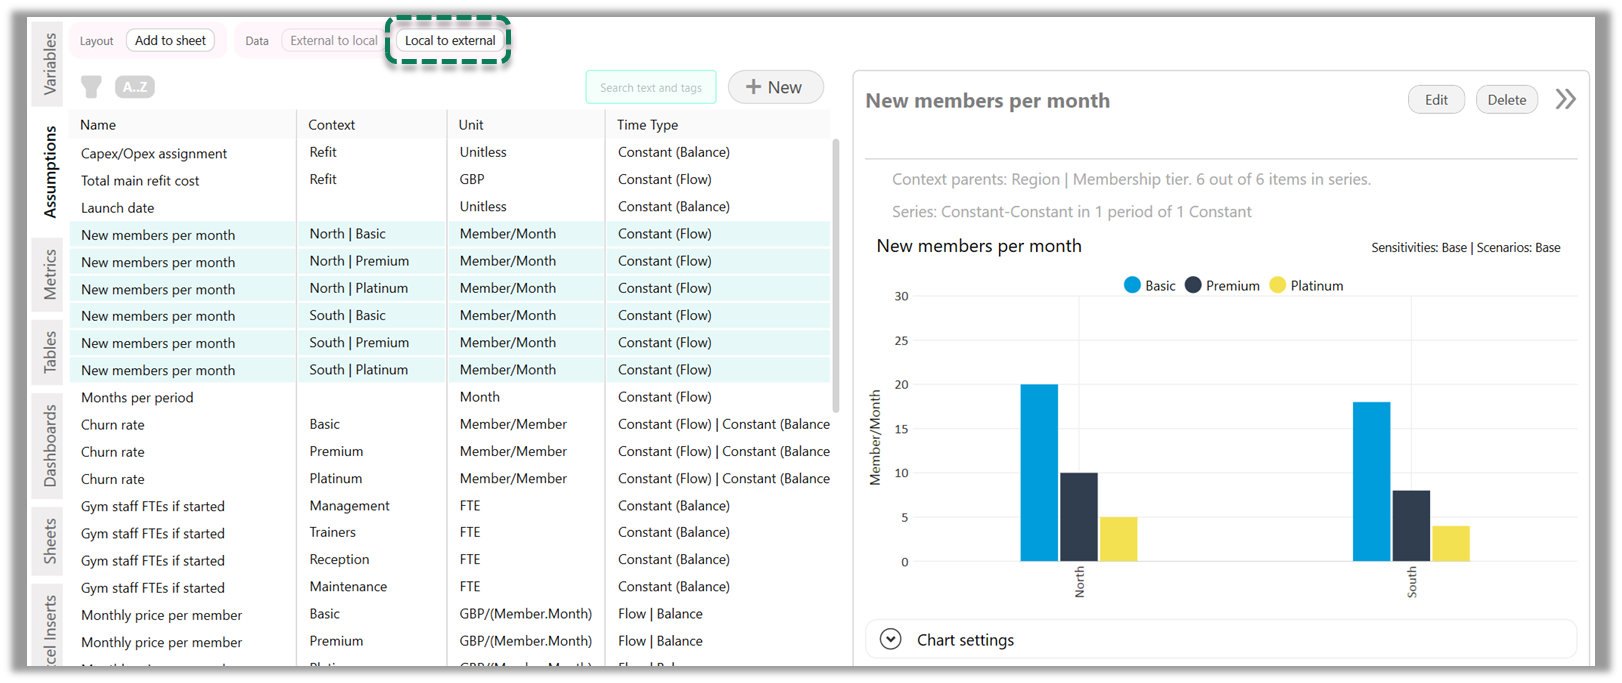
<figure><img src="https://2847533834-files.gitbook.io/~/files/v0/b/gitbook-x-prod.appspot.com/o/spaces%2FVy65sax6FVoNo2UTlJ0x%2Fuploads%2F8RQER0zbFk99OYDocJ0Z%2Fimage.png?alt=media&amp;token=c5eb131c-98ba-43e6-af7b-2ffe793ec6d4" alt="Screenshot showing a list of assumptions, with some assumptions selected. A context button is highlighted, which allows the conversion of local assumptions to external data."><figcaption><p>Converting local values to Data</p></figcaption></figure>

In the Assumptions list, If you select one or more Assumptions with local values, you will see a button (highlighted in the screenshot above) to convert the selected local values to Data.

Pressing the button will open a new wizard in which you can:

* Select which Scenarios you would like to convert to Data (only shown if more than one Scenario contains local Data)
* Select a [**Data Source**](/data/data-sources) to apply to the Data

Completing the wizard will create the new Data and reference it from your Assumptions.

## Converting Data to Local Values

<figure><img src="https://2847533834-files.gitbook.io/~/files/v0/b/gitbook-x-prod.appspot.com/o/spaces%2FVy65sax6FVoNo2UTlJ0x%2Fuploads%2FdITqg51Tae6GtQnQP2nM%2Fimage.png?alt=media&amp;token=7569785e-a655-447b-ad05-f1e8b04f7b3e" alt="Screenshot showing the assumptions list, with three assumptions selected. These assumptions link to external data, so a button is shown allowing the user to convert the data to local assumptions."><figcaption><p>Converting Data to local values</p></figcaption></figure>

The converse operation is also possible, converting Assumptions that reference external Data to local values.

If you select one or more Assumptions that reference external Data (as indicated by the <img src="https://2847533834-files.gitbook.io/~/files/v0/b/gitbook-x-prod.appspot.com/o/spaces%2FVy65sax6FVoNo2UTlJ0x%2Fuploads%2FQpXWBQJ1XACRJFoPi5hw%2Fimage.png?alt=media&amp;token=88c58489-bc8e-4b6d-9a44-51870cf96128" alt="" data-size="line">arrow next to the value <mark style="color:green;">**(1)**</mark> ), you will see a button <mark style="color:green;">**(2)**</mark> to convert the Data to local values.

Pressing the button will open a new wizard which will prompt you to select whether or not to delete the Data after converting.


# Linking to Excel Inserts

How to link Assumptions to Excel Inserts

## Overview

As described in the [**Excel Inserts**](/excel-inserts-and-outputs/excel-inserts) help sections, you can connect custom Excel sheets to your generated Model, either by creating [**Outputs**](/excel-inserts-and-outputs/excel-outputs) from your Model, or by linking [**Assumptions**](/assumptions/introduction-to-assumptions) to your Inserts - this page deals with the second of these.

{% hint style="info" %}
Generally, we advise against linking Assumptions to Excel Inserts if it can be avoided. If your inputs are produced by a dynamic Excel model, you will not be able to control this model from within the [**Model Editor**](/models/model-editor), and there's usually a way to produce whatever inputs you need in Models!
{% endhint %}

## Linking to Insert inputs

Assumptions are linked to Inserts via [**Named Ranges**](https://support.microsoft.com/en-us/office/define-and-use-names-in-formulas-4d0f13ac-53b7-422e-afd2-abd7ff379c64). You will need to create a Named Range in your Insert that represents your input data, and then tell Models how to link to that Named Range.

The following example illustrates this process.

### Example link to Excel Insert

In this example, we have some input data for the `New members per month` Variable that we want to take from a custom Excel sheet, as shown below. The input data is in a 3x2 table, with one `Membership type` per row, and one `Region` per column. This input sheet is contained in an Excel Insert that we have already created, called `Volume Input`. To make the input data accessible from Models, we must assign a Named Range to it: in this case, we have given it the name `Input_NewMembersPerMonth`.

<figure><img src="https://2847533834-files.gitbook.io/~/files/v0/b/gitbook-x-prod.appspot.com/o/spaces%2FVy65sax6FVoNo2UTlJ0x%2Fuploads%2FyEveNG0afSO7eg3mi7iI%2Fimage.png?alt=media&amp;token=3a9b7d04-05c4-437d-8083-d410546bfb60" alt="Section of an Excel spreadsheet, used as an Excel Insert in Models. A range of cells to be used as an input has been assigned as an Excel Named Range"><figcaption><p><strong>Excel Insert</strong> with input data</p></figcaption></figure>

To link our data to this input, we select and Edit the relevant Assumptions, as shown below.

<figure><img src="https://2847533834-files.gitbook.io/~/files/v0/b/gitbook-x-prod.appspot.com/o/spaces%2FVy65sax6FVoNo2UTlJ0x%2Fuploads%2FVqC5mrFBYoATOmypH1rG%2Fimage.png?alt=media&amp;token=dd774943-4e92-42bc-822f-d5ae11dd191a" alt="Screenshot of the Assumptions list, with several assumptions selected, highlighting the Edit button in the preview panel"><figcaption><p>Editing Assumptions</p></figcaption></figure>

This opens an **Assumptions dialog**. First, we change the source type to `Link to Excel Insert` (1), which results in several additional steps being shown. In the **Link to Insert** step, we choose the `Volume Input` Insert <mark style="color:green;">**(2)**</mark>, and the `Input_NewMembersPerMonth` Named Range <mark style="color:green;">**(3)**</mark>.

{% hint style="warning" %}
Before this point, you should ensure that the linked workbook is not open in Excel, so that Models can successfully access information about its Named Ranges.
{% endhint %}

<figure><img src="https://2847533834-files.gitbook.io/~/files/v0/b/gitbook-x-prod.appspot.com/o/spaces%2FVy65sax6FVoNo2UTlJ0x%2Fuploads%2F06gmlYtm3UUH9X7bgG9D%2Fimage.png?alt=media&amp;token=d2f0f157-2ee6-46e8-8566-1d6d3c13642c" alt=""><figcaption><p><strong>Assumptions dialog</strong>: Linking to Excel Insert</p></figcaption></figure>

Once you have selected a Named Range, you then need to give Models information about the shape of the data in that Named Range. You do this by matching the layout of data in the input workbook to the displayed table in Models. In the example below, we drag the `Region` [**Dimension**](/dimensions/introduction-to-dimensions) to the Horizontal section <mark style="color:green;">**(4)**</mark>, which results in the correct table configuration <mark style="color:green;">**(5)**</mark>.

<figure><img src="https://2847533834-files.gitbook.io/~/files/v0/b/gitbook-x-prod.appspot.com/o/spaces%2FVy65sax6FVoNo2UTlJ0x%2Fuploads%2FoUzC8QKJoRsqJjMRLsr3%2Fimage.png?alt=media&amp;token=c955883f-a8a0-4d2f-8ed4-5214640756b8" alt="Screenshots showing how to manipulate Dimensions to correctly link to Excel Insert data inputs"><figcaption><p><strong>Assumptions dialog:</strong> Matching shape of input data</p></figcaption></figure>

Finally, we need to enter some default values for the data <mark style="color:green;">**(6)**</mark>, so that Models can calculate its values when it does not have access to the Excel Insert (Models will not extract data from the input workbook when re-calculating the Model). Note that in the example below, we have arranged the table with `Region` on the horizontal axis so that we can copy and paste data directly from the input workbook.

<figure><img src="https://2847533834-files.gitbook.io/~/files/v0/b/gitbook-x-prod.appspot.com/o/spaces%2FVy65sax6FVoNo2UTlJ0x%2Fuploads%2FVOYsfpsjWs5P3DLDOjBf%2Fimage.png?alt=media&amp;token=0440baaf-224d-44c5-a9a8-ddc05fa4a6a2" alt="Screenshot showing Default Values page of Assumptions dialog. The user has entered values to use when the Excel Insert input is not available." width="563"><figcaption><p><strong>Assumptions dialog:</strong> Entering default values</p></figcaption></figure>


# Sensitivity Values

How to edit Assumption sensitivities

## Overview

<figure><img src="https://2847533834-files.gitbook.io/~/files/v0/b/gitbook-x-prod.appspot.com/o/spaces%2FVy65sax6FVoNo2UTlJ0x%2Fuploads%2FVE59BNeLpkBNuH1wV9OJ%2Fimage.png?alt=media&amp;token=b0f992e6-91ee-42a3-ba19-41f337364263" alt=""><figcaption><p>Sensitivities step of the Assumptions dialog</p></figcaption></figure>

Optionally, for any Assumption, you can add [**Sensitivities**](/cases/managing-sensitivities) that will vary the value of the Assumption according to certain rules.

{% hint style="info" %}
This is an optional step of the Assumptions wizard, and you will be able to exit from the wizard before reaching this point
{% endhint %}

## Sensitivity type

You can choose from one of 3 sensitivity types:

<table><thead><tr><th width="231">Sensitivity type</th><th>Details</th><th>Example</th></tr></thead><tbody><tr><td><code>Percentage change</code></td><td>Varies from base value by a percentage</td><td>Base Value = 10<br>Sensitivity Value = +20%<br>Used Value = 12</td></tr><tr><td><code>Delta</code></td><td>Varies from base value by an absolute amount</td><td>Base Value = 10<br>Sensitivity Value = 2<br>Used Value = 12</td></tr><tr><td><code>Absolute</code></td><td>Replaces base value with an absolute amount</td><td>Base Value = 10<br>Sensitivity Value = 12<br>Used Value = 12</td></tr></tbody></table>

{% hint style="info" %}
Available Sensitivity Types will depend on [**Data Type**](/data-types/data-types) of the Assumption. For instance, `Validation` and `String` Assumptions can only have `Absolute` sensitivities.
{% endhint %}

## Sensitivity value entry

Add any sensitivity values to the table displayed. You do not have to enter any values, as by default, no sensitivity is applied unless specified.


# Introduction to Calculations

Key concepts to understand about Models Calculations

## Overview

**Calculations** allow you to specify relationships between [**Variables**](/variables/variable-basics).

> For instance, `Profits = Revenues - Costs` where `Profits`, `Revenues`, and `Costs` are all Variables

With Calculations you can replicate most of the operations you'd perform in an Excel formula, including Date/Time, Logical, Lookup, and Mathematical functions.

{% hint style="info" %}
For a full list of supported Excel functions, see [**here**](/calculations/calculation-parts/functions#list-of-supported-functions)
{% endhint %}

## Calculation Parts

Calculations are made up of [**Calculation Parts**](/calculations/calculation-parts). When you create a Calculation, you create a list of Calculation Parts which you can rearrange and edit as in any [**list view**](/using-taglo-software/the-taglo-interface/list-views).

> For example, the Calculation `SUM(Cost1, Cost2)` contains six Calculation Parts:
>
> * `SUM` : A Sum Function
> * `(` and `)` : Opening and Closing brackets surrounding the Function content
> * `Cost1` and `Cost2`: Variable References
> * `,`: Comma between Function arguments&#x20;

You don't usually need to think about Calculation Parts as you can type a formula directly into the [**Formula Entry Bar**](/calculations/the-calculation-page/the-formula-entry-bar), which creates the associated Calculation Parts automatically. However, you can use the Calculation Part list to edit specific items (e.g. [**Variable References**](/calculations/calculation-parts/variable-references)) and quickly rearrange/edit your Calculation.


# The Calculation Page

Overview of the Calculation page

## The Calculation Page

<figure><img src="https://2847533834-files.gitbook.io/~/files/v0/b/gitbook-x-prod.appspot.com/o/spaces%2FVy65sax6FVoNo2UTlJ0x%2Fuploads%2F4gnUnZx9rUA1gZ7lRdyd%2Fimage.png?alt=media&amp;token=6665044b-d1b0-449d-b7ef-05df2f3ed414" alt="Screenshot of the Calculations Page of the Variables wizard"><figcaption><p>The Calculations Page of the Variable wizard</p></figcaption></figure>

The Calculation page of the Variable wizard has several key features, as shown in the screenshot above:

1. [**Formula Entry Bar**](/calculations/the-calculation-page/the-formula-entry-bar)
2. [**Unit analysis**](/calculations/the-calculation-page/unit-analysis)
3. [**Calculation Part**](/calculations/calculation-parts) list
4. Calculation Part preview

These features are covered in the following sections


# The Formula Entry Bar

How to create Calculations in the Formula Entry Bar

## Overview

<figure><img src="https://2847533834-files.gitbook.io/~/files/v0/b/gitbook-x-prod.appspot.com/o/spaces%2FVy65sax6FVoNo2UTlJ0x%2Fuploads%2FxFdNoTRyX2esGAd2EYXH%2FFormula%20entry.gif?alt=media&amp;token=ce57b83b-cd3d-4455-a38e-323d621ad5d6" alt="GIF showing a user entering a calculation into the Formula Entry bar. As the user types, a dropdown appears with the names of Variables and other items to choose from."><figcaption><p>Formula Entry Bar example</p></figcaption></figure>

The **Formula Entry Bar** in the Calculations step of the [**Variable**](/variables/variable-basics) dialog is the fastest way to create Calculations, by typing in a formula, similarly to how you would in Excel.

## Autocomplete Dropdown

On typing any text in the Formula Entry Bar, an autocomplete dropdown will appear, as in the examples below:

| Dropdown example                                                                                                                                                                                                                                          | Details                                                                                                                                                                                                                                                                                                                                                                                                                                                                                                                                                                                                                                                                                                                                                                                                                                                                                                                                                                                                                                                                                                                                                                                                                                                                                                                                                                                                                                                                                                                                                                                                                                                                                                                                              |
| --------------------------------------------------------------------------------------------------------------------------------------------------------------------------------------------------------------------------------------------------------- | ---------------------------------------------------------------------------------------------------------------------------------------------------------------------------------------------------------------------------------------------------------------------------------------------------------------------------------------------------------------------------------------------------------------------------------------------------------------------------------------------------------------------------------------------------------------------------------------------------------------------------------------------------------------------------------------------------------------------------------------------------------------------------------------------------------------------------------------------------------------------------------------------------------------------------------------------------------------------------------------------------------------------------------------------------------------------------------------------------------------------------------------------------------------------------------------------------------------------------------------------------------------------------------------------------------------------------------------------------------------------------------------------------------------------------------------------------------------------------------------------------------------------------------------------------------------------------------------------------------------------------------------------------------------------------------------------------------------------------------------------------- |
| <img src="https://2847533834-files.gitbook.io/~/files/v0/b/gitbook-x-prod.appspot.com/o/spaces%2FVy65sax6FVoNo2UTlJ0x%2Fuploads%2FvcFWbZCB7E1C17AhhOfH%2Fimage.png?alt=media&amp;token=02dc8d76-bf9d-4835-8670-f90376670c36" alt="" data-size="original"> | <p>Typed in <mark style="color:green;"><strong>"Peri"</strong></mark><br><br>Brings up options for:</p><ul><li><img src="https://2847533834-files.gitbook.io/~/files/v0/b/gitbook-x-prod.appspot.com/o/spaces%2FVy65sax6FVoNo2UTlJ0x%2Fuploads%2FFW6Ck7SEID1gZzAxiE3O%2Fimage.png?alt=media&amp;token=9730500e-68d0-418f-8485-d67ed4bd5aa7" alt="" data-size="line">Adding <a href="/calculations/calculation-parts/period-references"><strong>reference to current Period</strong></a></li><li><img src="https://2847533834-files.gitbook.io/~/files/v0/b/gitbook-x-prod.appspot.com/o/spaces%2FVy65sax6FVoNo2UTlJ0x%2Fuploads%2F35QMm9JxFWIpeTWGhReN%2Fimage.png?alt=media&amp;token=3f1135d5-83ff-47e0-860a-bb5bec71ae50" alt="" data-size="line"> Adding reference to an <a href="/calculations/calculation-parts/variable-references"><strong>existing Variable</strong></a> (<code>Months per period</code>)</li><li><img src="https://2847533834-files.gitbook.io/~/files/v0/b/gitbook-x-prod.appspot.com/o/spaces%2FVy65sax6FVoNo2UTlJ0x%2Fuploads%2F2QIbqoU3OlN2Zy9jBn8Z%2Fimage.png?alt=media&amp;token=70717151-ef8b-43d2-9ee7-5def597065c7" alt="" data-size="line">Adding a reference to a <a href="#referencing-a-new-variable"><strong>new Variable</strong></a> named <code>Peri</code></li><li><img src="https://2847533834-files.gitbook.io/~/files/v0/b/gitbook-x-prod.appspot.com/o/spaces%2FVy65sax6FVoNo2UTlJ0x%2Fuploads%2FsjsWpi5iI4NAaUf7u9xq%2Fimage.png?alt=media&amp;token=ba61b650-d373-4ec3-9ca7-b4442d321bf0" alt="" data-size="line"> Adding a new <a href="/calculations/calculation-parts/functions/advanced-functions#creating-a-lambda"><strong>Lambda</strong></a> function named <code>Peri()</code></li></ul> |
| <img src="https://2847533834-files.gitbook.io/~/files/v0/b/gitbook-x-prod.appspot.com/o/spaces%2FVy65sax6FVoNo2UTlJ0x%2Fuploads%2FulexiaosnFTIZ7RrxYHQ%2Fimage.png?alt=media&amp;token=c6c9082c-4331-4e37-ae07-6c7416d3cf72" alt="" data-size="original"> | <p>Typed in <mark style="color:green;"><strong>"Month"</strong></mark><br><br>Brings up options for:<br></p><ul><li><img src="https://2847533834-files.gitbook.io/~/files/v0/b/gitbook-x-prod.appspot.com/o/spaces%2FVy65sax6FVoNo2UTlJ0x%2Fuploads%2F35QMm9JxFWIpeTWGhReN%2Fimage.png?alt=media&amp;token=3f1135d5-83ff-47e0-860a-bb5bec71ae50" alt="" data-size="line"> Adding a reference to two existing Variables </li><li><img src="https://2847533834-files.gitbook.io/~/files/v0/b/gitbook-x-prod.appspot.com/o/spaces%2FVy65sax6FVoNo2UTlJ0x%2Fuploads%2F2QIbqoU3OlN2Zy9jBn8Z%2Fimage.png?alt=media&amp;token=70717151-ef8b-43d2-9ee7-5def597065c7" alt="" data-size="line">Adding a reference to a new Variable named <code>Month</code> </li><li><img src="https://2847533834-files.gitbook.io/~/files/v0/b/gitbook-x-prod.appspot.com/o/spaces%2FVy65sax6FVoNo2UTlJ0x%2Fuploads%2FEqvErA3pSSvvNSgEiQ3C%2Fimage.png?alt=media&amp;token=38064ec9-dcea-4091-9b3e-79b053f16ee8" alt="" data-size="line">Adding a <a href="/calculations/calculation-parts/functions"><strong>Function</strong></a> (either <code>EOMONTH</code> or <code>MONTH</code>)</li><li><img src="https://2847533834-files.gitbook.io/~/files/v0/b/gitbook-x-prod.appspot.com/o/spaces%2FVy65sax6FVoNo2UTlJ0x%2Fuploads%2FsjsWpi5iI4NAaUf7u9xq%2Fimage.png?alt=media&amp;token=ba61b650-d373-4ec3-9ca7-b4442d321bf0" alt="" data-size="line"> Adding a new Lambda function named <code>Month()</code></li></ul>                                                                                                                                                                                                                                                      |

Autocomplete options can be selected in any one of three ways:

1. Press **`Tab`** to select the first option in the list
2. Click on an option with the **Mouse**
3. Press **`Down`** (arrow key) to navigate through the list, and then press **`Enter`** to select an item

### Full list of Autocomplete option types

<table><thead><tr><th width="132.33333333333331">Symbol</th><th width="257">Type</th><th>Details</th></tr></thead><tbody><tr><td><img src="https://2847533834-files.gitbook.io/~/files/v0/b/gitbook-x-prod.appspot.com/o/spaces%2FVy65sax6FVoNo2UTlJ0x%2Fuploads%2FI1X8fGzSKkeVO9Vv1WyX%2Fimage.png?alt=media&amp;token=746066da-b35a-4474-a1f6-558820d83fc8" alt="" data-size="line"></td><td>Variable Reference</td><td>Creates a <a href="/calculations/calculation-parts/variable-references#creating-a-variable-reference"><strong>reference</strong></a> to an existing Variable</td></tr><tr><td><img src="https://2847533834-files.gitbook.io/~/files/v0/b/gitbook-x-prod.appspot.com/o/spaces%2FVy65sax6FVoNo2UTlJ0x%2Fuploads%2FcSExyXm1Agn3a3FcGZeU%2Fimage.png?alt=media&amp;token=fdc44f44-2b94-454a-a70f-06589f49f90d" alt="" data-size="line"></td><td>Reference to New Variable</td><td>Opens a wizard to create a new Variable; Adds a reference to the new Variable once created</td></tr><tr><td><img src="https://2847533834-files.gitbook.io/~/files/v0/b/gitbook-x-prod.appspot.com/o/spaces%2FVy65sax6FVoNo2UTlJ0x%2Fuploads%2FE6nG060VzPevzHuWuSIv%2Fimage.png?alt=media&amp;token=632da849-81d0-4963-8b01-1429ed28a5e9" alt="" data-size="line"></td><td>Period Reference</td><td>Creates a <a href="/calculations/calculation-parts/period-references"><strong>reference to a Period</strong></a> of the Model (a date value)</td></tr><tr><td><img src="https://2847533834-files.gitbook.io/~/files/v0/b/gitbook-x-prod.appspot.com/o/spaces%2FVy65sax6FVoNo2UTlJ0x%2Fuploads%2FJIldbFzkM2jM9CSFvfF2%2Fimage.png?alt=media&amp;token=9b16cd8e-f77e-4824-992c-b60eac8a67df" alt="" data-size="line"></td><td>Function</td><td>Adds a (supported) <a href="/calculations/calculation-parts/functions"><strong>Function</strong></a> name and opening bracket</td></tr><tr><td><img src="https://2847533834-files.gitbook.io/~/files/v0/b/gitbook-x-prod.appspot.com/o/spaces%2FVy65sax6FVoNo2UTlJ0x%2Fuploads%2FwKVcVvRjvWkSlpNtaSpR%2Fimage.png?alt=media&amp;token=0a77ac24-6594-45de-8e05-098b1edec0fa" alt="" data-size="line"></td><td>Lambda function</td><td>Adds a reference to an existing <a href="/calculations/calculation-parts/functions/advanced-functions#lambda-functions"><strong>LAMBDA</strong></a> function</td></tr><tr><td><img src="https://2847533834-files.gitbook.io/~/files/v0/b/gitbook-x-prod.appspot.com/o/spaces%2FVy65sax6FVoNo2UTlJ0x%2Fuploads%2FsjsWpi5iI4NAaUf7u9xq%2Fimage.png?alt=media&amp;token=ba61b650-d373-4ec3-9ca7-b4442d321bf0" alt="" data-size="line"></td><td>New Lambda function</td><td>Opens a wizard to create a new LAMBDA function, and then creates a reference to it</td></tr><tr><td><img src="https://2847533834-files.gitbook.io/~/files/v0/b/gitbook-x-prod.appspot.com/o/spaces%2FVy65sax6FVoNo2UTlJ0x%2Fuploads%2FjbYMqhn22FySNnKaxr3z%2Fimage.png?alt=media&amp;token=a1db9e95-9d6d-4626-9459-2ef770e9491a" alt="" data-size="line"></td><td>New Argument</td><td>Applies to <a href="/calculations/calculation-parts/functions/advanced-functions#let-functions"><strong>LET</strong></a> and <a href="/calculations/calculation-parts/functions/advanced-functions#lambda-functions"><strong>LAMBDA</strong></a> functions. Creates a new argument which can be referenced in subsequent sections of the function.</td></tr><tr><td><img src="https://2847533834-files.gitbook.io/~/files/v0/b/gitbook-x-prod.appspot.com/o/spaces%2FVy65sax6FVoNo2UTlJ0x%2Fuploads%2FSpQ9Z7GmEoTxdfY2NHRD%2Fimage.png?alt=media&amp;token=92768ea3-6cd8-49bd-be01-9548781dea93" alt="" data-size="line"></td><td>Argument Reference</td><td>Applies to LET and LAMBDA functions. References a previously defined argument.</td></tr></tbody></table>

## Referencing a new Variable

The [**Taglo interface**](/using-taglo-software/the-taglo-interface) allows you to create and reference a new Variable from within another Variable's calculation, without having to leave the Variable that you are currently editing.

This means you can stay within your current train of thought at all times.

To do so, follow these steps:

1. Start typing a name for your new Variable in the Formula Entry Bar
2. Select the new Variable (<img src="https://2847533834-files.gitbook.io/~/files/v0/b/gitbook-x-prod.appspot.com/o/spaces%2FVy65sax6FVoNo2UTlJ0x%2Fuploads%2FcqxvHDr4pLHPJLcIXbqu%2Fimage.png?alt=media&amp;token=c192b4c2-01d7-457c-a125-7fc9513ae8c3" alt="" data-size="line">) autocomplete item in the dropdown
3. A new dialog will open - edit your new Variable here
4. Click Finish in the new dialog - a reference to your new Variable will be created in the formula

## Entering Text

To enter text strings, type your text into the Formula Bar using a <mark style="color:green;">**"**</mark> character (double quotes) to indicate the start and end of the string. When you enter the second <mark style="color:green;">**"**</mark>, a Text [**Calculation Part**](/calculations/calculation-parts) will be created.

## Entering Numbers

To enter numbers, type the number directly into the Formula Bar. Any numbers typed in will automatically be interpreted as a number.

{% hint style="info" %}
Generally, it is not advisable to hardcode numbers into Calculations. Try to create Variables for these numbers instead.<br>

There are exceptions to this rule such as the hardcoded `1` in inflation formulas like `Cost = Cost[-1] * (1 + Inflation)`
{% endhint %}

{% hint style="warning" %}
If you have a Variable name which starts as a number, this means you may not find it easy to add from the autocomplete dropdown, in which case you can use the **Add Variable Reference** <img src="https://2847533834-files.gitbook.io/~/files/v0/b/gitbook-x-prod.appspot.com/o/spaces%2FVy65sax6FVoNo2UTlJ0x%2Fuploads%2FP8KQWmyuqD9IyTuTNIjj%2Fimage.png?alt=media&amp;token=71429008-be57-4e1f-abdd-0ba033fdf26a" alt="" data-size="line">button which can be found at the end of the list of Calculation Parts.
{% endhint %}


# Unit Analysis

How to keep track of Units when creating a Calculation

## Overview

The Calculation page analyses the Unit of your Calculation as you are creating it. This helps you check your Calculation for logical consistency, and provides clues to the Unit of Variables required to finish your Calculation.

The Calculation page shows two or three items:

<table data-header-hidden><thead><tr><th width="244">Unit analysis item</th><th>Details</th></tr></thead><tbody><tr><td><strong>Target Unit</strong></td><td>The Unit of the Variable in which we are creating the Calculation.<br><br><em>Note: If you haven't defined a Unit for the Variable, this will be guessed based on context</em></td></tr><tr><td><strong>Current Unit</strong></td><td>The Unit currently produced by the Calculation.<br><br>This item will show warning messages if a Unit cannot be determined.</td></tr><tr><td><strong>Remaining Unit</strong></td><td>The Unit required to finish the Calculation with the Target Unit.<br><br>The remaining Unit will only be shown if the entered formula is empty ends in an operator (<code>+</code>, <code>-</code>, <code>/</code>, <code>*</code>).</td></tr></tbody></table>

## Worked Example

In this example, we are creating a Variable called `Gym Revenues`, which is equal to `Gym members * Revenue per member`.

`Gym Revenues` has a Unit of `GBP`.

### Step 1

<figure><img src="https://2847533834-files.gitbook.io/~/files/v0/b/gitbook-x-prod.appspot.com/o/spaces%2FVy65sax6FVoNo2UTlJ0x%2Fuploads%2FHLQ2WnyixuZTZ8MWvagT%2Fimage.png?alt=media&amp;token=a42ac73c-e10b-41ec-9d2a-f5758e24fbac" alt=""><figcaption><p>Step 1</p></figcaption></figure>

To begin with we have an empty formula. **Target Unit** shows our desired Unit (`GBP`). **Current Unit** shows that the Calculation is not currently valid. **Remaining Unit** shows that if we reference a Variable with Unit `GBP` we will have the correct Unit.

### Step 2

<figure><img src="https://2847533834-files.gitbook.io/~/files/v0/b/gitbook-x-prod.appspot.com/o/spaces%2FVy65sax6FVoNo2UTlJ0x%2Fuploads%2FqXwEilO7OdrjOQnVm1pf%2Fimage.png?alt=media&amp;token=b540dedc-3dbb-4897-8fbc-fb3ae6ad3b24" alt=""><figcaption><p>Step 2</p></figcaption></figure>

We enter a reference to `Gym Members`. This updates the **Current Unit** to `Member`, and alerts us that `Member` does not match the **Target Unit** of `GBP`. We have not entered an operator, so Models cannot determine the **Remaining Unit**.

### Step 3

<figure><img src="https://2847533834-files.gitbook.io/~/files/v0/b/gitbook-x-prod.appspot.com/o/spaces%2FVy65sax6FVoNo2UTlJ0x%2Fuploads%2F4MhBLdlOWO6mb7Dx4cdI%2Fimage.png?alt=media&amp;token=fa0078aa-e585-4983-843c-acf6e6c0f351" alt=""><figcaption><p>Step 3</p></figcaption></figure>

We enter a `*` (multiply) operator. Models can now work out that we need to reference a Variable with Unit `GBP / Member` in order to arrive at the Target Unit, as **Current Unit** \* **Remaining Unit** = **Target Unit**.

At this point, if we click on the **Add Variable Reference** ![](https://2847533834-files.gitbook.io/~/files/v0/b/gitbook-x-prod.appspot.com/o/spaces%2FVy65sax6FVoNo2UTlJ0x%2Fuploads%2FQdWH8BhVdevVv4g8aKN5%2Fimage.png?alt=media\&token=f04fcfc6-03dd-46a4-8003-2624e2606c8e) button in the  Calculation Part list, we will be shown only Variables that match the Remaining Unit of `GBP / Member`.

### Step 4

<figure><img src="https://2847533834-files.gitbook.io/~/files/v0/b/gitbook-x-prod.appspot.com/o/spaces%2FVy65sax6FVoNo2UTlJ0x%2Fuploads%2F60M1yhBOzPtaHS9BHEHT%2Fimage.png?alt=media&amp;token=089b9966-90e9-436f-ba99-a1c27aea5305" alt=""><figcaption><p>Step 4</p></figcaption></figure>

We add a reference to the `Revenue per member` Variable, which has Unit `GBP / Member`.

The **Current Unit** now matches the **Target Unit**.


# Calculation Parts

Overview of Calculation Parts

## List of available Calculation Parts

<table><thead><tr><th width="253">Calculation Part</th><th>Details</th></tr></thead><tbody><tr><td><code>Variable Reference</code></td><td>References the value of a <a href="/variables/variable-basics"><strong>Variable</strong></a></td></tr><tr><td><code>Period Reference</code></td><td>References the date value of a <a href="/models/home-tab/creating-a-model/timings"><strong>Period</strong></a> of the Model</td></tr><tr><td><code>Constant</code></td><td>Any numerical value</td></tr><tr><td><code>Text</code></td><td>Any text string</td></tr><tr><td><code>Operator</code></td><td>A mathematical operator: <code>+</code> <code>-</code> <code>*</code> <code>/</code> <code>^</code></td></tr><tr><td><code>Comparator</code></td><td>A comparison operator: <code>&#x3C;</code> <code>></code> <code>&#x3C;=</code> <code>>=</code> <code>=</code></td></tr><tr><td><code>Brackets</code></td><td>Parentheses <code>(</code> <code>)</code> to indicate order of calculation<br><em>or</em><br>Indicate start and end of a Function</td></tr><tr><td><code>Function</code></td><td>Performs a defined <a href="/calculations/calculation-parts/functions"><strong>Function</strong></a> on a set of arguments</td></tr><tr><td><code>Comma</code></td><td>Separates Function arguments</td></tr><tr><td><code>Lambda Reference</code></td><td>References a <a href="/calculations/calculation-parts/functions/advanced-functions#lambda-functions"><strong>Lambda</strong></a> function</td></tr><tr><td><code>Lambda Argument</code></td><td>Defines an argument for use in <a href="/calculations/calculation-parts/functions/advanced-functions#let-functions"><strong>Let</strong></a> and <a href="/calculations/calculation-parts/functions/advanced-functions#lambda-functions"><strong>Lambda</strong></a> functions</td></tr><tr><td><code>Lambda Argument Reference</code></td><td>References a Lambda Argument</td></tr></tbody></table>

{% hint style="info" %}
Calculations follow standard mathematical order of evaluation: Brackets > Order > Products (Division or Multiplication) > Sums (Addition or Subtraction)
{% endhint %}

The following sections go into detail on some of these Calculation Parts.


# Variable References

How to reference a Variable in a Calculation

## Creating a Variable Reference

Most references to Variables are created in one of two ways:

<figure><img src="https://2847533834-files.gitbook.io/~/files/v0/b/gitbook-x-prod.appspot.com/o/spaces%2FVy65sax6FVoNo2UTlJ0x%2Fuploads%2F4UDO1JHWTwD4Alyxl0lE%2Fimage.png?alt=media&amp;token=777e318f-c70e-4e96-b121-5f4d01f804e8" alt="Screenshot showing two ways of adding a reference to a Variable in a Calculation. One through the dropdown, and one through the Add Variable Reference button."><figcaption><p>Adding a Variable Reference</p></figcaption></figure>

1. From the [**Formula Entry Bar**](/calculations/the-calculation-page/the-formula-entry-bar), by typing a name and selecting the relevant Variable from the dropdown list <mark style="color:green;">**(1)**</mark>.
2. Clicking on the **Add Variable Reference** button at the bottom of the list of Calculation Parts <mark style="color:green;">**(2)**</mark>.

The first option is great when you know the name of the Variable you want to reference, and can access it quickly via a simple text search.

The second option is useful when you are unsure of the name, and want to browse through the full list of Variables, or for when you want to see a list of Variables that match the [**Remaining Unit**](/calculations/the-calculation-page/unit-analysis).

When you enter a Variable using one of these methods, the default behaviour is:

* The current period will be referenced
* If the referenced Variable has [**Dimensions**](/dimensions/introduction-to-dimensions), Models will make its best evaluation of which item(s) should be referenced, depending on the source Variable

If the default behaviour is not desired, you can configure the reference in detail to your requirements. The following sections explain the ways in which you can do this.


# Referencing Time

How to reference specific Periods of a Variable

## Time Offset

By default Calculations reference other Variables' values from the same Period of the Model.

> For instance, for a Model in Years, by default a Variable will calculate its value for 2025 by getting the values from its referenced Variables in 2025.

To make most Models useful, you will need to reference previous Periods in the Model at multiple points. You can do this using a Time Offset.

As shown in the example below, a Time Offset is indicated in a Calculation's formula by a negative number in square brackets (e.g., `[-1]` ) to the right of the referenced Variable name.

<figure><img src="https://2847533834-files.gitbook.io/~/files/v0/b/gitbook-x-prod.appspot.com/o/spaces%2FVy65sax6FVoNo2UTlJ0x%2Fuploads%2FZQ4a4yBSsQ8Ol24xkjIX%2Fimage.png?alt=media&amp;token=813a9e8f-027f-489b-ae1a-be929f0c1931" alt=""><figcaption><p>Example of a Calculation with a Time Offset</p></figcaption></figure>

The number in brackets refers to the number of periods relative to the current period from which a Variable should take the referenced value. In the example above, this calculation takes the previous period's value of `Gym members`.

{% hint style="info" %}
If you reference a Variable from its own Calculation, it will automatically have a `[-1]` offset applied, in order to avoid circular references.
{% endhint %}

{% hint style="info" %}
In Models, Time Offsets **must be 0 or negative**. You cannot refer to future periods.
{% endhint %}

## Time Ranges

By default Calculations reference a single period of a Variable. You can choose to reference multiple or specific periods of the Model using Time Ranges.

As shown in the example below, Time Ranges are indicated in a Calculation's formula by a description in square brackets (e.g. `[Starts at: First period, Ends at: Last period]`).

<figure><img src="https://2847533834-files.gitbook.io/~/files/v0/b/gitbook-x-prod.appspot.com/o/spaces%2FVy65sax6FVoNo2UTlJ0x%2Fuploads%2FWcjzOhDvC3sQm4WBFdaP%2Fimage.png?alt=media&amp;token=5946f423-9143-4885-ad29-633fe7686276" alt=""><figcaption><p>Example of a Calculation with a Time Range</p></figcaption></figure>

The above example calculates the cumulative revenues since the beginning of the Model. In this case, the Time Range for the `Revenues` Variable starts at the first period of the model, and ends at the current period.

{% hint style="info" %}
Time Ranges are particularly useful when creating [**Metrics**](/metrics/metrics), which summarise information about the Model as a whole. When you refer to a Variable from a Metric, by default it will reference the entire Model time range.
{% endhint %}

{% hint style="warning" %}
When you use a Time Range from within a Variable, you should take care not to reference future Periods, as this will lead to Calculation errors.
{% endhint %}

When creating a Time Range, you can define any two of:

1. Start period
2. Duration
3. End period

At least one of these parameters must be set to `Auto`. If all three are set to `Auto`, the reference will refer to the current period.

#### Start/End period

The Start and End periods can be defined as below:

<table><thead><tr><th width="243">Period type</th><th>Details</th></tr></thead><tbody><tr><td><code>Auto</code></td><td>Refers to current period</td></tr><tr><td><code>Fixed period</code></td><td>Refers to a specific period (e.g. <code>June 2023</code>)</td></tr><tr><td><code>Periods from start</code></td><td>Refers to a period that is a defined number of periods after the start. First period = <code>1</code></td></tr><tr><td><code>Periods from end</code></td><td>Refers to a period that is a defined number of periods before the end. Last period = <code>1</code></td></tr></tbody></table>

#### Duration

Duration can be defined as `Fill`, which will be the number of periods between the Start and End periods, or `# of Periods` (a defined number of periods).

> For instance, if the Start Period is defined as the First Period, and the End Period is Auto (Current Period), the duration will be the number of periods between the first period and the current period.&#x20;

## Setting the Offset and Range

There are two ways of editing the Time Offset and Range.

1. Shortcut buttons in Calculation Part list
2. Calculation Part editing dialog

### Shortcut buttons

<figure><img src="https://2847533834-files.gitbook.io/~/files/v0/b/gitbook-x-prod.appspot.com/o/spaces%2FVy65sax6FVoNo2UTlJ0x%2Fuploads%2FRbYRnTg8Vtka2zcN1KL2%2Fimage.png?alt=media&amp;token=02a540a2-26cc-4d2e-9e20-8c817324538c" alt="Screenshots showing how to change the time offset of a Variable reference using the shortcut buttons."><figcaption><p>Setting an offset to the previous period using shortcuts</p></figcaption></figure>

As in the example above, each Periods or Variable Reference Calculation Part displays a shortcut button which can be pressed to show a list of actions to change the Time Offset or Time Range.

Press the **Reset** button at the bottom of the list to revert to a the default single current period reference.

### Calculation Part wizard

Detailed properties of any Calculation Part can be edited through a wizard as in any [**list view**](/using-taglo-software/the-taglo-interface/previewing-and-editing#preview-actions).

In the Calculation Part wizard, navigate to the **Reference Range** step, where you can edit the Offset and Range properties manually, as shown in the example below.

{% hint style="info" %}
The Reference Range step is only available for Variable and Period References
{% endhint %}

<figure><img src="https://2847533834-files.gitbook.io/~/files/v0/b/gitbook-x-prod.appspot.com/o/spaces%2FVy65sax6FVoNo2UTlJ0x%2Fuploads%2FcO6Q91rH5TncIZtiEMT7%2FTime%20range.gif?alt=media&amp;token=b14aff75-a86a-48f2-b899-2241b5ec5f3a" alt=""><figcaption><p>Creating a Calculation using a Time Range reference</p></figcaption></figure>


# Referencing Dimensions

How to configure references to Dimensions

## Auto Relationships

When you create a reference to a Variable that has [**Dimensions**](/dimensions/introduction-to-dimensions), Models needs to know which items within that Variable to reference when performing Calculations.

Most of the time, Models can automatically work out which items to reference.

For instance, in the example below, `Revenues by region and membership type` has the [**Calculation**](/calculations/introduction-to-calculations) `Gym members [Auto] * Revenue per member [Auto]`.

The `[Auto]` suffix to the Variable references indicates that Models will automatically deduce the correct relationships, based on Dimensions.

`Revenues by region and membership type` and `Gym members` both have two Dimensions: `Region` and `Membership Tier` - they vary both regionally and by gym package.

`Revenue per member` only has one Dimension, `Membership Tier`, as the price of the gym does not vary by region.

For each item of `Revenues by region and membership type`, Models will take the matching line from each of the reference Variables.

<figure><img src="https://2847533834-files.gitbook.io/~/files/v0/b/gitbook-x-prod.appspot.com/o/spaces%2FVy65sax6FVoNo2UTlJ0x%2Fuploads%2FfI4eAhzYxguV3VY1OxnS%2Fimage.png?alt=media&amp;token=07f62f7a-ad2a-4e42-a703-08e87dbfb4d1" alt=""><figcaption><p>Example: Automatic Dimensions references. NOTE: Displayed values are rounded and will not produce calculated outputs shown</p></figcaption></figure>

## Custom relationships

We can configure the way that Dimensions are referenced.

For example, let's say we want to create a new Variable called `Revenue if everyone is Platinum`.

We use the same formula as in the example above (`Gym members * Revenue per member`), but this time we want the `Revenue per member` reference to only use the `Platinum` value.

To do this, we open the Calculation Part wizard for the `Revenue per member` Variable Reference, and navigate to the **Reference type** step, as shown below:

<figure><img src="https://2847533834-files.gitbook.io/~/files/v0/b/gitbook-x-prod.appspot.com/o/spaces%2FVy65sax6FVoNo2UTlJ0x%2Fuploads%2FrGIbo8LX7TuSSAglh5YH%2Fimage.png?alt=media&amp;token=99e9c5c8-35f2-4f62-bc1f-7ab19e118441" alt="Screenshots showing how to create a custom relationships to a Variable using the Calculation Part editor wizard"><figcaption><p>Setting a Custom Dimension relationship</p></figcaption></figure>

In the item match dropdown, we select a **Custom** match <mark style="color:green;">**(1)**</mark>. A new step is displayed which allows us to customise the match for the `Membership Tier` Dimension. Here, we can specify that it should always link to the `Platinum` item <mark style="color:green;">**(2)**</mark>, rather than varying based on the source Variable's Dimension.

This results in the desired calculation, as shown below:

<figure><img src="https://2847533834-files.gitbook.io/~/files/v0/b/gitbook-x-prod.appspot.com/o/spaces%2FVy65sax6FVoNo2UTlJ0x%2Fuploads%2F4WIJAWcgErS3OLaPvkBQ%2Fimage.png?alt=media&amp;token=72cb2a88-f829-4788-a2b8-8f0f2eeebfd0" alt=""><figcaption><p>Example: Custom Dimensions references. NOTE: Displayed values are rounded and will not produce calculated outputs shown</p></figcaption></figure>


# Lookups

How to create a lookup reference

## Overview

Sometimes you will need to lookup a [**Variable**](/variables/variable-basics)'s value based on another Variable's value.

> For instance, let's say we have a Model with four cost categories. For each cost category we want to apply one of two inflation types, RPI or CPI (Retail and Consumer Price Index respectively). We want to be able to dynamically choose between the two options, and for the cost item to use the correct inflation value automatically.

This is achieved using a Lookup reference - we explain how you can achieve this below.

{% hint style="info" %}
This is the kind of operation you typically perform in Excel with an INDEX-MATCH formula, or an [**XLOOKUP**](https://support.microsoft.com/en-us/office/xlookup-function-b7fd680e-6d10-43e6-84f9-88eae8bf5929#:~:text=The%20XLOOKUP%20function%20searches%20a,Argument)
{% endhint %}

## Lookup reference example

<figure><img src="https://2847533834-files.gitbook.io/~/files/v0/b/gitbook-x-prod.appspot.com/o/spaces%2FVy65sax6FVoNo2UTlJ0x%2Fuploads%2FFUr5M5V85TYPUDBTj9vr%2Fimage.png?alt=media&amp;token=0eb68e48-e889-4c66-b4e5-b4374e2a8b99" alt=""><figcaption><p>Example of a Lookup reference</p></figcaption></figure>

This above example illustrates the scenario described in the [**Overview**](#overview). `Recurring cost inflation` pulls its values from `Inflation by type` according to the selected value in `Recurring cost inflation types`.

## Creating the Lookup reference

To create a Lookup reference, perform the following steps, as illustrated in the screenshots below:

1. In the [**Calculation step**](/calculations/the-calculation-page), add a Variable reference to the target Variable <mark style="color:green;">**(1)**</mark> (in the above example `Inflation by type`) using [**any method**](/calculations/calculation-parts/variable-references#overview) - by default, the reference will be a Summary of the target Variable, because the target has different [**Dimensions**](/dimensions/introduction-to-dimensions), so an `Auto` reference is not possible.
2. Edit the Variable Reference Calculation Part that has been added <mark style="color:green;">**(2)**</mark>
3. In the **Reference type** page of the dialog, select a LOOKUP reference <mark style="color:green;">**(3)**</mark>
4. This will display a new step, in which you can select a Variable with which to perform the LOOKUP <mark style="color:green;">**(4)**</mark>. This Variable will need to have the same Dimensions as the Variable in which you are performing the Calculation. By default, this list will be filtered to Variables with the correct Dimensions.

{% hint style="info" %}
Create the Lookup Variable by using the [**Validation data type**](/variables/variable-basics/variable-setup#validation-dimension) - in this case using `Inflation type` as the Validation Dimension.
{% endhint %}

<figure><img src="https://2847533834-files.gitbook.io/~/files/v0/b/gitbook-x-prod.appspot.com/o/spaces%2FVy65sax6FVoNo2UTlJ0x%2Fuploads%2F47CxPJ1GfwF3QlZ2mNTA%2Fimage.png?alt=media&amp;token=2fe6073a-1feb-47dc-8b2e-2e15266bd240" alt="Screenshots showing the steps described in this section for creating a Lookup reference"><figcaption><p>Creating a Lookup reference</p></figcaption></figure>


# Summarising Variables

How to combine lines from Variables with Dimensions

## Overview

When referencing a [**Variable**](/variables/variable-basics) with one or more [**Dimensions**](/dimensions/introduction-to-dimensions), from a Variable with different Dimensions, we can summarise the target Variable in several different ways.

<table><thead><tr><th width="220.33333333333331">Summarise method</th><th>Details</th></tr></thead><tbody><tr><td><strong>Summary Line</strong></td><td>If the target Variable has a <a href="/variables/summaries#row-summary"><strong>row summary</strong></a>, the value of the row summary is returned</td></tr><tr><td><strong>New Summary</strong></td><td>Creates a custom summary - you can choose which lines of the target Variable are summed together</td></tr><tr><td><strong>Sum based on third Variable</strong></td><td>Sums Variable rows together according to a categorisation made in a third Variable</td></tr></tbody></table>

{% hint style="info" %}
By default, if you create a reference to a Variable which has Dimensions that do not match the Calculation Variable, a Summary Line reference will be created. If a Row Summary is not present in the target Variable, a New Summary adding together all lines of the target Variable will be created.
{% endhint %}

## Referencing the Summary Line

<figure><img src="https://2847533834-files.gitbook.io/~/files/v0/b/gitbook-x-prod.appspot.com/o/spaces%2FVy65sax6FVoNo2UTlJ0x%2Fuploads%2FZMCDSh3NRpHAnXgGTTAV%2Fimage.png?alt=media&amp;token=11775834-c901-415b-b211-6b98541b5ca3" alt=""><figcaption><p>Example Summary Line reference</p></figcaption></figure>

If the target Variable already has a [**row summary**](/variables/summaries#row-summary) line, your Calculation can simply reference that summary. This is indicated by an `[All]` suffix in the Variable reference.

This reference will often be created for you by default. If you need to create the reference yourself, edit the [**Calculation Part**](/calculations/calculation-parts) and select the option `Reference the SUMMARY line of the Variable` in the **Reference type** step, as shown below.

<figure><img src="https://2847533834-files.gitbook.io/~/files/v0/b/gitbook-x-prod.appspot.com/o/spaces%2FVy65sax6FVoNo2UTlJ0x%2Fuploads%2FUKRzPoXolF6sRjoSKZB0%2Fimage.png?alt=media&amp;token=90269c2f-ec29-451d-8571-10d653a67815" alt=""><figcaption><p>Creating a Summary Line reference</p></figcaption></figure>

## Creating a New Summary

### Example 1

<figure><img src="https://2847533834-files.gitbook.io/~/files/v0/b/gitbook-x-prod.appspot.com/o/spaces%2FVy65sax6FVoNo2UTlJ0x%2Fuploads%2FEvMr07ufCvIKE8iG9roB%2Fimage.png?alt=media&amp;token=1590f6de-b71b-4b8c-88dd-97b555e9d044" alt=""><figcaption><p>Example New Summary reference</p></figcaption></figure>

In the above example, we have created a Variable, `Platinum Revenues`, that sums together the `Platinum` items of the `Revenues by region and membership type` Variable.

This is achieved by creating a **New Summary** reference, via the following steps:

* Edit the Calculation Part and navigate to the **Reference type** page, as shown in the screenshot below
* Select the `Create a NEW SUMMARY` option <mark style="color:green;">**(1)**</mark> - this displays a new Variable summary step in which you can select the desired summary options <mark style="color:green;">**(2)**</mark>
* In this case, we need to select an option for each of the two target Dimensions, `Region` and `Membership tier`. As we are adding together the `Platinum` lines, we select **Sum** for `Region`, and `Platinum` for `Membership Tier`

<figure><img src="https://2847533834-files.gitbook.io/~/files/v0/b/gitbook-x-prod.appspot.com/o/spaces%2FVy65sax6FVoNo2UTlJ0x%2Fuploads%2FLcqDq4PHSGFslVUudQ3P%2Fimage.png?alt=media&amp;token=995fcf5f-9d3c-4e03-8d37-ec3e17ca394e" alt=""><figcaption><p>Creating a New Summary: Example steps</p></figcaption></figure>

### Example 2

<figure><img src="https://2847533834-files.gitbook.io/~/files/v0/b/gitbook-x-prod.appspot.com/o/spaces%2FVy65sax6FVoNo2UTlJ0x%2Fuploads%2F3VNvGceSTPhA5soSIPSP%2Fimage.png?alt=media&amp;token=ea634094-70fe-42a2-a49c-023d056bf92a" alt=""><figcaption><p>Example New Summary reference</p></figcaption></figure>

In this example, we have created a Variable, `Revenues by region`, which has the `Region` Dimension applied, and we want to sum together all revenues for each region.

To do this, we follow the same steps as in Example 1, but this time we have an option <mark style="color:green;">**(1)**</mark> to link the `Region` Dimension in the target Variable to the `Region` Dimension in the Calculation Variable.

{% hint style="info" %}
In this situation, Models would automatically generate this summary when the reference is created, as it can see that the `Region` Dimension is present in both Variables.
{% endhint %}

<figure><img src="https://2847533834-files.gitbook.io/~/files/v0/b/gitbook-x-prod.appspot.com/o/spaces%2FVy65sax6FVoNo2UTlJ0x%2Fuploads%2FGZTqAnxwb5i2icYnwakp%2Fimage.png?alt=media&amp;token=930864d4-2bd1-42c5-9cbf-f2c3a76107a4" alt=""><figcaption><p>Creating a New Summary: Example steps</p></figcaption></figure>

## Summarising by a third Variable

<figure><img src="https://2847533834-files.gitbook.io/~/files/v0/b/gitbook-x-prod.appspot.com/o/spaces%2FVy65sax6FVoNo2UTlJ0x%2Fuploads%2F9fNfUzcvYOFQlibmg8tS%2Fimage.png?alt=media&amp;token=adb48ae6-73a8-4267-890a-98e32f3db3e3" alt=""><figcaption><p>Example Summary by a third Variable</p></figcaption></figure>

In the example above, we have seven cost items, which we want to assign to either `Capex` or `Opex` and then automatically sum up the totals for the two types of cost.

We can achieve this in a single Variable reference as follows:

* Edit the Calculation Part and navigate to the **Reference type** page, as shown in the screenshot below
* Select the `SUM lines together based on a third Variable` option <mark style="color:green;">**(1)**</mark> - this displays a new Variable selector step in which you can select the assignment Variable <mark style="color:green;">**(2)**</mark>
* In this step, select a Variable with which to perform the assignment. This Variable will need to have the same Dimensions as the referenced Variable. By default, this list will be filtered to Variables with the correct Dimensions.

{% hint style="info" %}
Create the assignment Variable by using the [**Validation data type**](/variables/variable-basics/variable-setup#validation-dimension) - in this case using `Opex/Capex` as the Validation Dimension.
{% endhint %}

<figure><img src="https://2847533834-files.gitbook.io/~/files/v0/b/gitbook-x-prod.appspot.com/o/spaces%2FVy65sax6FVoNo2UTlJ0x%2Fuploads%2FoIpK03rMy0S03skehtsU%2Fimage.png?alt=media&amp;token=3e0287b6-4ccf-47d8-b6fd-185dde314f89" alt=""><figcaption><p>Summarising based on a third Variable: Example steps</p></figcaption></figure>


# Period References

How to reference Periods from Calculations

## Overview

If you need to use a date from your Model's [**Timings**](/models/home-tab/creating-a-model/timings) in a [**Calculation**](/calculations/introduction-to-calculations), you can do this using a Period Reference [**Calculation Part**](/calculations/calculation-parts).

When you reference a period of the Model, the value returned is a representation of the number of days since 1st January 1900 at the end of the period, as explained in the [**Data Types documentation**](/data-types/data-types#datetime-date-treatments), equivalent to the treatment of dates in Excel.

> For instance, if you want to calculate the number of days in a period of the Model, you would use the Calculation `Periods - Period [-1]`. This subtracts the date value at the end of the previous period from the date value at the end of the current period.

## Creating Period References

There are 3 ways of creating a Period Reference:

1. Use the [**AutoComplete dropdown**](/calculations/the-calculation-page/the-formula-entry-bar#full-list-of-autocomplete-option-types) in the Formula Entry Bar (type "Periods" and select the Periods item as indicated by the clock<img src="https://2847533834-files.gitbook.io/~/files/v0/b/gitbook-x-prod.appspot.com/o/spaces%2FVy65sax6FVoNo2UTlJ0x%2Fuploads%2FOLGmxk5yoRDa06Dzmn7D%2Fimage.png?alt=media&amp;token=a58c7b14-9bab-4ae1-bae3-f65e7de60092" alt="" data-size="line">symbol)
2. Add a new Calculation Part, and select `Period` from the part type options
3. Use the **Periods** <img src="https://2847533834-files.gitbook.io/~/files/v0/b/gitbook-x-prod.appspot.com/o/spaces%2FVy65sax6FVoNo2UTlJ0x%2Fuploads%2F2nWSVovEi4pcPmC7KIFB%2Fimage.png?alt=media&amp;token=975e87c2-3a8f-41d9-8692-986c0ccbaad5" alt="" data-size="line"> shortcut button which can be found at the bottom of the Calculation Part list

## Editing Period References

Periods References can reference single or multiple time periods, and reference offset periods, similarly to Variable References.

See the [**Variable References documentation**](/calculations/calculation-parts/variable-references/referencing-time) for details of how to edit these.&#x20;


# Functions

Introduction to Functions in Models

## Overview

[**Models**](/models/home-tab) supports many of the Functions that you are used to using in Excel, from logical functions like `IF()` and `AND()`, to financial functions like `XNPV()` and `IRR()`.

<figure><img src="https://2847533834-files.gitbook.io/~/files/v0/b/gitbook-x-prod.appspot.com/o/spaces%2FVy65sax6FVoNo2UTlJ0x%2Fuploads%2FwYc7RcZMAx6x1c1aVn0D%2Fimage.png?alt=media&amp;token=ea651fc5-0473-4b54-a8a0-9732054ecc62" alt=""><figcaption><p>Example of an IF function in Models</p></figcaption></figure>

In fact, all Models functions are Excel functions, meaning you can always generate working Excel spreadsheets from your Models.

You can also create custom functions using the LET/LAMBDA features, which are explained in the [**Advanced Functions section**](/calculations/calculation-parts/functions/advanced-functions).

{% hint style="info" %}
Not all Excel functions are fully supported in Models. You can still use non-supported functions to generate working Excel spreadsheets, but they will not show up in the AutoComplete dropdown, and Models will not be able to calculate values.

See the [**full list of supported functions below**](#list-of-supported-functions).
{% endhint %}

## Entering a Function

The simplest way to create a Function is to simply type the Function name in the [**Formula Entry Bar**](/calculations/the-calculation-page/the-formula-entry-bar).

Typing the name followed by an opening parentheses will create the relevant [**Calculation Parts**](/calculations/calculation-parts), or you can select the Function from the [**AutoComplete dropdown**](/calculations/the-calculation-page/the-formula-entry-bar#autocomplete-dropdown) - functions are indicated by the function <img src="https://2847533834-files.gitbook.io/~/files/v0/b/gitbook-x-prod.appspot.com/o/spaces%2FVy65sax6FVoNo2UTlJ0x%2Fuploads%2FFcngWLM4lVdSB4jgp6Go%2Fimage.png?alt=media&amp;token=c43b4ff1-5e00-49d1-9878-466b10b4584c" alt="" data-size="line"> symbol.

As in Excel, Function arguments are separated by commas.

{% hint style="warning" %}
We have not yet implemented an Intellisense equivalent for Function arguments (i.e. where the user interface indicates the name and purpose of each argument).

Please refer to [**Excel documentation**](https://support.microsoft.com/en-us/office/excel-functions-by-category-5f91f4e9-7b42-46d2-9bd1-63f26a86c0eb) or test the Function from within Excel to see the required arguments for an unfamiliar Function.
{% endhint %}

## List of supported Functions

See [**Excel documentation**](https://support.microsoft.com/en-us/office/excel-functions-by-category-5f91f4e9-7b42-46d2-9bd1-63f26a86c0eb) for full list of Excel functions.

<table><thead><tr><th width="192">Name</th><th>Excel Category</th><th data-type="content-ref">Microsoft Documentation</th></tr></thead><tbody><tr><td>DATE</td><td>Date and time</td><td><a href="https://support.microsoft.com/en-us/office/date-function-e36c0c8c-4104-49da-ab83-82328b832349">https://support.microsoft.com/en-us/office/date-function-e36c0c8c-4104-49da-ab83-82328b832349</a></td></tr><tr><td>DAY</td><td>Date and time</td><td><a href="https://support.microsoft.com/en-us/office/day-function-8a7d1cbb-6c7d-4ba1-8aea-25c134d03101">https://support.microsoft.com/en-us/office/day-function-8a7d1cbb-6c7d-4ba1-8aea-25c134d03101</a></td></tr><tr><td>EDATE</td><td>Date and time</td><td><a href="https://support.microsoft.com/en-us/office/edate-function-3c920eb2-6e66-44e7-a1f5-753ae47ee4f5">https://support.microsoft.com/en-us/office/edate-function-3c920eb2-6e66-44e7-a1f5-753ae47ee4f5</a></td></tr><tr><td>EOMONTH</td><td>Date and time</td><td><a href="https://support.microsoft.com/en-us/office/eomonth-function-7314ffa1-2bc9-4005-9d66-f49db127d628">https://support.microsoft.com/en-us/office/eomonth-function-7314ffa1-2bc9-4005-9d66-f49db127d628</a></td></tr><tr><td>MONTH</td><td>Date and time</td><td><a href="https://support.microsoft.com/en-us/office/month-function-579a2881-199b-48b2-ab90-ddba0eba86e8">https://support.microsoft.com/en-us/office/month-function-579a2881-199b-48b2-ab90-ddba0eba86e8</a></td></tr><tr><td>WEEKDAY</td><td>Date and time</td><td><a href="https://support.microsoft.com/en-us/office/weekday-function-60e44483-2ed1-439f-8bd0-e404c190949a">https://support.microsoft.com/en-us/office/weekday-function-60e44483-2ed1-439f-8bd0-e404c190949a</a></td></tr><tr><td>YEAR</td><td>Date and time</td><td><a href="https://support.microsoft.com/en-us/office/year-function-c64f017a-1354-490d-981f-578e8ec8d3b9">https://support.microsoft.com/en-us/office/year-function-c64f017a-1354-490d-981f-578e8ec8d3b9</a></td></tr><tr><td>YEARFRAC</td><td>Date and time</td><td><a href="https://support.microsoft.com/en-us/office/yearfrac-function-3844141e-c76d-4143-82b6-208454ddc6a8">https://support.microsoft.com/en-us/office/yearfrac-function-3844141e-c76d-4143-82b6-208454ddc6a8</a></td></tr><tr><td>IRR</td><td>Financial</td><td><a href="https://support.microsoft.com/en-us/office/irr-function-64925eaa-9988-495b-b290-3ad0c163c1bc">https://support.microsoft.com/en-us/office/irr-function-64925eaa-9988-495b-b290-3ad0c163c1bc</a></td></tr><tr><td>XNPV</td><td>Financial</td><td><a href="https://support.microsoft.com/en-us/office/xnpv-function-1b42bbf6-370f-4532-a0eb-d67c16b664b7">https://support.microsoft.com/en-us/office/xnpv-function-1b42bbf6-370f-4532-a0eb-d67c16b664b7</a></td></tr><tr><td>AND</td><td>Logical</td><td><a href="https://support.microsoft.com/en-us/office/and-function-5f19b2e8-e1df-4408-897a-ce285a19e9d9">https://support.microsoft.com/en-us/office/and-function-5f19b2e8-e1df-4408-897a-ce285a19e9d9</a></td></tr><tr><td>IF</td><td>Logical</td><td><a href="https://support.microsoft.com/en-us/office/if-function-69aed7c9-4e8a-4755-a9bc-aa8bbff73be2">https://support.microsoft.com/en-us/office/if-function-69aed7c9-4e8a-4755-a9bc-aa8bbff73be2</a></td></tr><tr><td>IFERROR</td><td>Logical</td><td><a href="https://support.microsoft.com/en-us/office/iferror-function-c526fd07-caeb-47b8-8bb6-63f3e417f611">https://support.microsoft.com/en-us/office/iferror-function-c526fd07-caeb-47b8-8bb6-63f3e417f611</a></td></tr><tr><td>NOT</td><td>Logical</td><td><a href="https://support.microsoft.com/en-us/office/not-function-9cfc6011-a054-40c7-a140-cd4ba2d87d77">https://support.microsoft.com/en-us/office/not-function-9cfc6011-a054-40c7-a140-cd4ba2d87d77</a></td></tr><tr><td>OR</td><td>Logical</td><td><a href="https://support.microsoft.com/en-us/office/or-function-7d17ad14-8700-4281-b308-00b131e22af0">https://support.microsoft.com/en-us/office/or-function-7d17ad14-8700-4281-b308-00b131e22af0</a></td></tr><tr><td>FILTER</td><td>Lookup and reference</td><td><a href="https://support.microsoft.com/en-us/office/filter-function-f4f7cb66-82eb-4767-8f7c-4877ad80c759">https://support.microsoft.com/en-us/office/filter-function-f4f7cb66-82eb-4767-8f7c-4877ad80c759</a></td></tr><tr><td>INDEX</td><td>Lookup and reference</td><td><a href="https://support.microsoft.com/en-us/office/index-function-a5dcf0dd-996d-40a4-a822-b56b061328bd">https://support.microsoft.com/en-us/office/index-function-a5dcf0dd-996d-40a4-a822-b56b061328bd</a></td></tr><tr><td>CEILING</td><td>Math and trigonometry</td><td><a href="https://support.microsoft.com/en-us/office/ceiling-function-0a5cd7c8-0720-4f0a-bd2c-c943e510899f">https://support.microsoft.com/en-us/office/ceiling-function-0a5cd7c8-0720-4f0a-bd2c-c943e510899f</a></td></tr><tr><td>CEILING.MATH</td><td>Math and trigonometry</td><td><a href="https://support.microsoft.com/en-us/office/ceiling-math-function-80f95d2f-b499-4eee-9f16-f795a8e306c8">https://support.microsoft.com/en-us/office/ceiling-math-function-80f95d2f-b499-4eee-9f16-f795a8e306c8</a></td></tr><tr><td>EXP</td><td>Math and trigonometry</td><td><a href="https://support.microsoft.com/en-us/office/exp-function-c578f034-2c45-4c37-bc8c-329660a63abe">https://support.microsoft.com/en-us/office/exp-function-c578f034-2c45-4c37-bc8c-329660a63abe</a></td></tr><tr><td>FLOOR</td><td>Math and trigonometry</td><td><a href="https://support.microsoft.com/en-us/office/floor-function-14bb497c-24f2-4e04-b327-b0b4de5a8886">https://support.microsoft.com/en-us/office/floor-function-14bb497c-24f2-4e04-b327-b0b4de5a8886</a></td></tr><tr><td>FLOOR.MATH</td><td>Math and trigonometry</td><td><a href="https://support.microsoft.com/en-us/office/floor-math-function-c302b599-fbdb-4177-ba19-2c2b1249a2f5">https://support.microsoft.com/en-us/office/floor-math-function-c302b599-fbdb-4177-ba19-2c2b1249a2f5</a></td></tr><tr><td>LN</td><td>Math and trigonometry</td><td><a href="https://support.microsoft.com/en-us/office/ln-function-81fe1ed7-dac9-4acd-ba1d-07a142c6118f">https://support.microsoft.com/en-us/office/ln-function-81fe1ed7-dac9-4acd-ba1d-07a142c6118f</a></td></tr><tr><td>LOG</td><td>Math and trigonometry</td><td><a href="https://support.microsoft.com/en-us/office/log-function-4e82f196-1ca9-4747-8fb0-6c4a3abb3280">https://support.microsoft.com/en-us/office/log-function-4e82f196-1ca9-4747-8fb0-6c4a3abb3280</a></td></tr><tr><td>MOD</td><td>Math and trigonometry</td><td><a href="https://support.microsoft.com/en-us/office/mod-function-9b6cd169-b6ee-406a-a97b-edf2a9dc24f3">https://support.microsoft.com/en-us/office/mod-function-9b6cd169-b6ee-406a-a97b-edf2a9dc24f3</a></td></tr><tr><td>PI</td><td>Math and trigonometry</td><td><a href="https://support.microsoft.com/en-us/office/pi-function-264199d0-a3ba-46b8-975a-c4a04608989b">https://support.microsoft.com/en-us/office/pi-function-264199d0-a3ba-46b8-975a-c4a04608989b</a></td></tr><tr><td>POWER</td><td>Math and trigonometry</td><td><a href="https://support.microsoft.com/en-us/office/power-function-d3f2908b-56f4-4c3f-895a-07fb519c362a">https://support.microsoft.com/en-us/office/power-function-d3f2908b-56f4-4c3f-895a-07fb519c362a</a></td></tr><tr><td>PRODUCT</td><td>Math and trigonometry</td><td><a href="https://support.microsoft.com/en-us/office/product-function-8e6b5b24-90ee-4650-aeec-80982a0512ce">https://support.microsoft.com/en-us/office/product-function-8e6b5b24-90ee-4650-aeec-80982a0512ce</a></td></tr><tr><td>RAND</td><td>Math and trigonometry</td><td><a href="https://support.microsoft.com/en-us/office/rand-function-4cbfa695-8869-4788-8d90-021ea9f5be73">https://support.microsoft.com/en-us/office/rand-function-4cbfa695-8869-4788-8d90-021ea9f5be73</a></td></tr><tr><td>ROUND</td><td>Math and trigonometry</td><td><a href="https://support.microsoft.com/en-us/office/round-function-c018c5d8-40fb-4053-90b1-b3e7f61a213c">https://support.microsoft.com/en-us/office/round-function-c018c5d8-40fb-4053-90b1-b3e7f61a213c</a></td></tr><tr><td>ROUNDDOWN</td><td>Math and trigonometry</td><td><a href="https://support.microsoft.com/en-us/office/rounddown-function-2ec94c73-241f-4b01-8c6f-17e6d7968f53">https://support.microsoft.com/en-us/office/rounddown-function-2ec94c73-241f-4b01-8c6f-17e6d7968f53</a></td></tr><tr><td>ROUNDUP</td><td>Math and trigonometry</td><td><a href="https://support.microsoft.com/en-us/office/roundup-function-f8bc9b23-e795-47db-8703-db171d0c42a7">https://support.microsoft.com/en-us/office/roundup-function-f8bc9b23-e795-47db-8703-db171d0c42a7</a></td></tr><tr><td>SQRT</td><td>Math and trigonometry</td><td><a href="https://support.microsoft.com/en-us/office/sqrt-function-654975c2-05c4-4831-9a24-2c65e4040fdf">https://support.microsoft.com/en-us/office/sqrt-function-654975c2-05c4-4831-9a24-2c65e4040fdf</a></td></tr><tr><td>SUM</td><td>Math and trigonometry</td><td><a href="https://support.microsoft.com/en-us/office/sum-function-043e1c7d-7726-4e80-8f32-07b23e057f89">https://support.microsoft.com/en-us/office/sum-function-043e1c7d-7726-4e80-8f32-07b23e057f89</a></td></tr><tr><td>SUMPRODUCT</td><td>Math and trigonometry</td><td><a href="https://support.microsoft.com/en-us/office/sumproduct-function-16753e75-9f68-4874-94ac-4d2145a2fd2e">https://support.microsoft.com/en-us/office/sumproduct-function-16753e75-9f68-4874-94ac-4d2145a2fd2e</a></td></tr><tr><td>AVERAGE</td><td>Math and trigonometry</td><td><a href="https://support.microsoft.com/en-us/office/average-function-047bac88-d466-426c-a32b-8f33eb960cf6">https://support.microsoft.com/en-us/office/average-function-047bac88-d466-426c-a32b-8f33eb960cf6</a></td></tr><tr><td>MAX</td><td>Math and trigonometry</td><td><a href="https://support.microsoft.com/en-us/office/max-function-e0012414-9ac8-4b34-9a47-73e662c08098">https://support.microsoft.com/en-us/office/max-function-e0012414-9ac8-4b34-9a47-73e662c08098</a></td></tr><tr><td>MIN</td><td>Math and trigonometry</td><td><a href="https://support.microsoft.com/en-us/office/min-function-61635d12-920f-4ce2-a70f-96f202dcc152">https://support.microsoft.com/en-us/office/min-function-61635d12-920f-4ce2-a70f-96f202dcc152</a></td></tr><tr><td>LET</td><td>Other</td><td><a href="https://support.microsoft.com/en-us/office/let-function-34842dd8-b92b-4d3f-b325-b8b8f9908999">https://support.microsoft.com/en-us/office/let-function-34842dd8-b92b-4d3f-b325-b8b8f9908999</a></td></tr><tr><td>LAMBDA</td><td>Other</td><td><a href="https://support.microsoft.com/en-us/office/lambda-function-bd212d27-1cd1-4321-a34a-ccbf254b8b67">https://support.microsoft.com/en-us/office/lambda-function-bd212d27-1cd1-4321-a34a-ccbf254b8b67</a></td></tr></tbody></table>


# Advanced Functions

How to create custom functions using LET and LAMBDA

## Overview

Microsoft has added two powerful features in recent years which effectively allow users to create custom functions.

There are many benefits to using these functions, including:

* Improved readability of formulas
* Minimising the number of references to Calculation inputs
* Making complex functions reusable

To understand how LET and LAMBDA functions work, we recommend reading the Microsoft documentation. Links are included in the relevant sections below.

{% hint style="warning" %}
LET and LAMBDA functions are available in Office 365 versions of Excel. If you are using older versions of Excel, you can still use these functions within Models, but they will not produce working Excel spreadsheets.
{% endhint %}

## LET functions

{% hint style="info" %}
If you are new to LET functions, first read the [**Microsoft documentation here**](https://support.microsoft.com/en-us/office/let-function-34842dd8-b92b-4d3f-b325-b8b8f9908999)
{% endhint %}

To create a LET function, you can type the function into the [**Formula Entry Bar**](/calculations/the-calculation-page/the-formula-entry-bar), as you would for any other function, with two key differences: **Arguments** (called "variables" in the Microsoft documentation) and **References** to those arguments must be entered via the AutoComplete dropdown. This is demonstrated in the example below.

<figure><img src="https://2847533834-files.gitbook.io/~/files/v0/b/gitbook-x-prod.appspot.com/o/spaces%2FVy65sax6FVoNo2UTlJ0x%2Fuploads%2Fqi5IldDKrWIBI0cu9q1Z%2Fimage.png?alt=media&amp;token=e56ee61c-0f96-4288-8945-34e1878a7097" alt=""><figcaption><p>A LET function to find a root of a quadratic equation</p></figcaption></figure>

Let's say we want to create a LET function to find one of the roots of a quadratic equation, as shown above. This is useful as the arguments `a` and `b` are both used twice in the formula, so using a LET function means we only have to enter the input values for those arguments (which could be references to Variables) once.

When we enter each of the arguments (`a`, `b`, and `c`), we type in the name of the argument and then select the Argument Calculation Part with the plus in braces symbol<img src="https://2847533834-files.gitbook.io/~/files/v0/b/gitbook-x-prod.appspot.com/o/spaces%2FVy65sax6FVoNo2UTlJ0x%2Fuploads%2FvTKPSWAlWJrkUIQOaifv%2Fimage.png?alt=media&amp;token=1fe8eb38-dd74-4827-8321-c074991e599a" alt="" data-size="line">from the AutoComplete dropdown, as shown below.

<figure><img src="https://2847533834-files.gitbook.io/~/files/v0/b/gitbook-x-prod.appspot.com/o/spaces%2FVy65sax6FVoNo2UTlJ0x%2Fuploads%2FUb9cR8fhh386l5WSv9jI%2Fimage.png?alt=media&amp;token=d2e0a0e7-9a2e-4104-9e77-8bf009140193" alt=""><figcaption><p>Creating a LET argument</p></figcaption></figure>

To reference these arguments, we type in the name of the argument, and select the Argument Reference Calculation Part with the comma in braces symbol <img src="https://2847533834-files.gitbook.io/~/files/v0/b/gitbook-x-prod.appspot.com/o/spaces%2FVy65sax6FVoNo2UTlJ0x%2Fuploads%2FhVupAJh2QfHwMVqLWz7k%2Fimage.png?alt=media&amp;token=5be8ed1e-5c9f-4d8b-b716-568ff3f4fca6" alt="" data-size="line">, as shown below.

<figure><img src="https://2847533834-files.gitbook.io/~/files/v0/b/gitbook-x-prod.appspot.com/o/spaces%2FVy65sax6FVoNo2UTlJ0x%2Fuploads%2FiR3tEumR2jOcGhNRI8IZ%2Fimage.png?alt=media&amp;token=b2057b42-87d5-4875-a6e3-e7c25d832a78" alt=""><figcaption><p>Referencing a LET argument</p></figcaption></figure>

## LAMBDA functions

{% hint style="info" %}
If you are new to LAMBDA functions, first read the [**Microsoft documentation here**](https://support.microsoft.com/en-us/office/lambda-function-bd212d27-1cd1-4321-a34a-ccbf254b8b67)
{% endhint %}

### Creating a Lambda

To create a LAMBDA function, go to the Lambda applet, which is accessible from the [**Navigation Bar**](/using-taglo-software/the-taglo-interface/navigating-in-models), or create one [**on the fly from the Formula Entry autocomplete menu**](/calculations/the-calculation-page/the-formula-entry-bar#full-list-of-autocomplete-option-types).

Lambdas are stored separately from Models so can be used in any Model that has access to the Lambda's [**Namespace**](/using-taglo-software/namespaces).

When you create a new Lambda you will need to perform the following steps, as per the screenshots below:

* Select a Namespace
* Choose a Name <mark style="color:green;">**(1)**</mark>. The name must obey Excel naming rules for [**Named Ranges**](https://support.microsoft.com/en-us/office/define-and-use-names-in-formulas-4d0f13ac-53b7-422e-afd2-abd7ff379c64), and not include spaces or certain special characters. The full rules are complex so we will not list them here, but the Lambda dialog will not let you proceed if the name does not meet the rules.
* Create the Arguments for the function <mark style="color:green;">**(2)**</mark>
* Enter the formula <mark style="color:green;">**(3)**</mark>

<figure><img src="https://2847533834-files.gitbook.io/~/files/v0/b/gitbook-x-prod.appspot.com/o/spaces%2FVy65sax6FVoNo2UTlJ0x%2Fuploads%2FfWu7iOUtsl6SXLZcrILO%2Fimage.png?alt=media&amp;token=f22e8747-c9f4-4132-a009-dd731222a8da" alt="" width="483"><figcaption><p>Creating a Lambda</p></figcaption></figure>

The Calculation entry step for a Lambda uses the same [**Formula Entry Bar**](/calculations/the-calculation-page/the-formula-entry-bar) as Variables, but with reduced capabilities (e.g. as Lambdas exist outside Models, you cannot reference Variables or Periods in a Lambda formula).

{% hint style="info" %}
Lambdas can reference other Lambdas - use this to greatly simplify complex calculations
{% endhint %}

### Using a Lambda function

Once you have created a Lambda function, it can be used in Models just like any other Function, as long as the Lambda's Namespace is available in your Model.

For instance, to use the `QuadraticRoot` Lambda from the above example, we would simply type the name of the Lambda into the Formula Entry Bar, select the function from the dropdown, and enter arguments as desired, as shown below.

<figure><img src="https://2847533834-files.gitbook.io/~/files/v0/b/gitbook-x-prod.appspot.com/o/spaces%2FVy65sax6FVoNo2UTlJ0x%2Fuploads%2F3Vk2Wu2YzsqaYw6y3Oly%2Fimage.png?alt=media&amp;token=e613024f-3a54-4c0e-8e1f-56ed0f0176ab" alt=""><figcaption><p>Using a Lambda function in a Calculation</p></figcaption></figure>


# Introduction to Aggregation

How to use Aggregation to improve Model structure

## Overview

As described in the Dimensions documentation, [**Dimensions**](/dimensions/introduction-to-dimensions) allow you to improve the quality of your Models while reducing complexity, by removing repetition of Calculations.

For instance, you might have several cost items in a business (e.g. Marketing, Salaries, IT, Rent) that you need to perform some common calculations on, such as working capital adjustments.

To do this efficiently, it is best to have these cost items in a single [**Variable**](/variables/variable-basics), in this case using a `Cost Type` or similar Dimension. However, the individual cost items are all calculated differently (e.g. Salaries and Rent), so we cannot use the `Cost Type` Dimension for all Calculations - we need to first calculate the individual items separately, and then bring them together under one Variable. This is where we use **Aggregation**.

## Aggregation Example

<figure><img src="https://2847533834-files.gitbook.io/~/files/v0/b/gitbook-x-prod.appspot.com/o/spaces%2FVy65sax6FVoNo2UTlJ0x%2Fuploads%2Ftze8G2JSyui5mZMQjmBg%2Fimage.png?alt=media&amp;token=6c3c7349-ca5e-45fd-b17f-ccf76d2760b7" alt=""><figcaption><p>Example of a Variable using Aggregation</p></figcaption></figure>

The screenshot above shows the preview for a Variable using Aggregation. The Variable uses a Dimension, `Cost Type` <mark style="color:green;">**(1)**</mark>, with seven children (`Central staff`, `Gym staff`, etc...).

The Variable has a single [**Time Segment**](/variables/time-segments) <mark style="color:green;">**(2)**</mark> that uses an Aggregation [**Formula**](/variables/time-segments/time-segment-setup#formula) in which the Cost Item Variables are referenced.&#x20;

{% hint style="success" %}
Note that the [**Row Summary**](/variables/summaries#row-summary) is set to `Sum`, providing an automatic sum of the seven Variables. This is a much cleaner method of adding these Variables together than creating a dedicated Calculation: (`Central Staff` + `Gym staff + Marketing cost` + `etc...)`
{% endhint %}

The next section explains how to create and configure an Aggregation Variable.


# Creating Aggregations

How to create and configure an Aggregation

## Aggregation in the Variable wizard

Aggregations are created in the [**Variable wizard**](/variables/variable-basics/variable-setup).

<figure><img src="https://2847533834-files.gitbook.io/~/files/v0/b/gitbook-x-prod.appspot.com/o/spaces%2FVy65sax6FVoNo2UTlJ0x%2Fuploads%2F7pGfCS12yGyfrTWKY6Cr%2Fimage.png?alt=media&amp;token=556ac773-1781-4fc3-8af5-7215e5c52764" alt="Screenshots of the Variable wizard, showing how to create an Aggregation"><figcaption><p>Creating an Aggregation in the Variable dialog</p></figcaption></figure>

To create an Aggregation you will need to perform the following steps, as per the screenshots above:

* Select the `Aggregation` **Variable type** <mark style="color:green;">**(1)**</mark>
* Assign at least one [**Dimension**](/dimensions/introduction-to-dimensions) to the Variable <mark style="color:green;">**(2)**</mark>
* Set the [**Unit**](/units/introduction-to-units) for the Variable, in the **Unit step**
* In the **Aggregated Variables step**, select the Variables to be aggregated <mark style="color:green;">**(3)**</mark>. The **Item Statuses** table <mark style="color:green;">**(4)**</mark> shows which items have been selected, and can be used to filter the Variable list to matching items.

{% hint style="warning" %}
Selected Variables must have the correct Unit so that Models can match them correctly to the target items. The below section explains several ways to set up these Variables.
{% endhint %}

## Creating Variables with the correct Unit for Aggregation

Each aggregated Variable must have a Unit which has been modified to match one of the child items of the Aggregation Variable.

For instance, in the above example, the Aggregation Variable (`All costs by cost type`) has a Unit of `GDP` and a Dimension of `Cost type`, which has seven children (`Central staff`, `Gym staff`, etc.).

To match a `Central staff` Variable, we need a Variable with a Unit of `GDP` which has had a `Central staff` modifier applied. To match a `Gym staff` Variable, we need a Variable with a Unit of `GDP` which has had a `Gym staff` modifier applied, and so on for each item.

The screenshot below shows such Units for the `Central staff` and `Gym staff` items.

<figure><img src="https://2847533834-files.gitbook.io/~/files/v0/b/gitbook-x-prod.appspot.com/o/spaces%2FVy65sax6FVoNo2UTlJ0x%2Fuploads%2FUguEDVL5nJPtHwq9GniL%2Fimage.png?alt=media&amp;token=b79880be-f38b-4fd8-ad06-f45ab9535d81" alt=""><figcaption><p>Variables with modified Units for Aggregation</p></figcaption></figure>

### Manual creation

These Variables can be created manually. In this case, the Unit should be specified with appropriate modifiers added, in the **Unit step** of the Variable wizard, as demonstrated in the gif below.

<figure><img src="https://2847533834-files.gitbook.io/~/files/v0/b/gitbook-x-prod.appspot.com/o/spaces%2FVy65sax6FVoNo2UTlJ0x%2Fuploads%2FvmONIfYhPncSMvGSTExI%2FUnit%20context%20modifier.gif?alt=media&amp;token=dd7a26d0-c075-4be6-8ab6-2d605a716cc9" alt="GIF showing the user setting a context modifier on a unit part in the Unit page of the Variables wizard"><figcaption><p>Setting a Unit Modifier</p></figcaption></figure>

Read [**here**](/units/key-unit-concepts#context) to understand more about Unit Modifiers.

### Automatic creation

If you have not already created the Variables to be aggregated, you can automatically create them in the [**Aggregated Variables step**](#aggregation-in-the-variable-dialog) of the Variable dialog.

To do so, perform the following steps, shown in the example screenshots below:

* Navigate to the **Aggregated Variables step**
* Select any items that you want to create in the **Item statuses** <mark style="color:green;">**(1)**</mark>. By default, all items will be selected. Selected items are indicated by the filter <img src="https://2847533834-files.gitbook.io/~/files/v0/b/gitbook-x-prod.appspot.com/o/spaces%2FVy65sax6FVoNo2UTlJ0x%2Fuploads%2FbVxi4wVrUuV7Hnmzehua%2Fimage.png?alt=media&amp;token=e2da0f72-8e02-4056-bfe4-640efbf9f3e2" alt="" data-size="line"> icon.
* Press the **Create selected** button <mark style="color:green;">**(2)**</mark>
* A Variable for each item will be automatically created, each with a correctly modified Unit <mark style="color:green;">**(3)**</mark>
* These new Variables should then be selected and edited as desired

<figure><img src="https://2847533834-files.gitbook.io/~/files/v0/b/gitbook-x-prod.appspot.com/o/spaces%2FVy65sax6FVoNo2UTlJ0x%2Fuploads%2FdqOZHEK1EQErf8b3tgnA%2Fimage.png?alt=media&amp;token=372d1301-050e-4029-b1a1-06b96568a314" alt=""><figcaption><p>Example of automatic aggregated Variable creation</p></figcaption></figure>

### Aggregating Variables with Dimensions

You can aggregate Variables which themselves have Dimensions, if some or all of the child items of their Dimension are present in the Aggregation Variable.&#x20;

The screenshot below shows an example of this feature. In this case, the `All costs by cost type` Variable references a Variable <mark style="color:green;">**(1)**</mark> called `Costs: Recurring`, which has the `Simple recurring cost type` Dimension applied.&#x20;

The `Simple recurring cost type` Dimension has four cost items as children: `Marketing cost`, `Rent`, `Equipment`, and `IT & Technology` <mark style="color:green;">**(2)**</mark>. Each of these four items are also present in the `Cost type` Dimension that is applied to `All costs by cost type`. Hence selecting `Costs: Recurring` means that Models is able to determine values for those four items, as indicated in the **Item statuses control&#x20;**<mark style="color:green;">**(3)**</mark>.

{% hint style="info" %}
In this case, you do not need to apply any Modifiers to the Unit of `Costs: Recurring.`&#x20;

`Costs: Recurring` already has Unit `GBP`, and the relevant Modifiers are applied in the background by the `Simple recurring cost type` Dimension
{% endhint %}

<figure><img src="https://2847533834-files.gitbook.io/~/files/v0/b/gitbook-x-prod.appspot.com/o/spaces%2FVy65sax6FVoNo2UTlJ0x%2Fuploads%2FlQ3Y5lqg5qnqZFlmGVAj%2Fimage.png?alt=media&amp;token=34ebe74f-7433-4574-be58-6a8f258f6d48" alt=""><figcaption><p>Example of an Aggregation referencing a Variable with a Dimension</p></figcaption></figure>


# Introduction to Rearranging

Why you might want to change the direction of your Calculation flows

## Overview

Usually, we think about our Models in a certain "direction", based on what's most important to us.

Let's say we are building a revenue forecast for our company selling widgets. The first Calculation we might think about is `Revenue = Widgets Sold * Price`, which looks like the below <mark style="color:green;">**(1)**</mark> in our Model:

<figure><img src="https://2847533834-files.gitbook.io/~/files/v0/b/gitbook-x-prod.appspot.com/o/spaces%2FVy65sax6FVoNo2UTlJ0x%2Fuploads%2FvzeRAbQTScjMH3DqRUNq%2Fimage.png?alt=media&amp;token=a855fda0-a044-4e10-908a-1141b34fa9b9" alt=""><figcaption><p>Calculation with Revenues as output</p></figcaption></figure>

The same Calculation might, however, just as easily be expressed as `Widgets Sold = Revenues / Price`, which would look like the below <mark style="color:green;">**(2)**</mark>.

<figure><img src="https://2847533834-files.gitbook.io/~/files/v0/b/gitbook-x-prod.appspot.com/o/spaces%2FVy65sax6FVoNo2UTlJ0x%2Fuploads%2FlIujQHo2wmkYsZuAmYqY%2Fimage.png?alt=media&amp;token=d68997d8-069f-4cef-8a7d-3a5160418e02" alt=""><figcaption><p>Calculation with Widgets Sold as output</p></figcaption></figure>

The way in which we express Calculations usually depends on what we consider to be inputs and outputs of our Model. In <mark style="color:green;">**(1)**</mark>, we know how many widgets we are selling and what the price is, and we want to calculate the revenues generated. In <mark style="color:green;">**(2)**</mark>, we know the revenues and price, and want to calculate the number of widgets sold.

Often, particularly when we are building Models that are a mix of **actual** and **forecast** data, what we consider to be an input and output will change over time.

For instance, in our example above, we want to forecast future Revenues as an output, but we only know historic Revenues and Price, and not the number of Widgets Sold. For historic periods, therefore, we want `Revenues` and `Price` to be inputs, and in future periods, we want `Widgets Sold` and `Price` to be inputs.

We can achieve this using **Rearranging**.

The next section walks through an example of how to do this in Models.


# Rearranging Example

Worked example of Rearranging

## Setup

For our forecast periods (2023 onwards), we want to calculate `Revenues` <mark style="color:green;">**(1)**</mark> as an output, so we start with a simple calculation, `Revenues = Widgets Sold * Price` <mark style="color:green;">**(2)**</mark>.

<figure><img src="https://2847533834-files.gitbook.io/~/files/v0/b/gitbook-x-prod.appspot.com/o/spaces%2FVy65sax6FVoNo2UTlJ0x%2Fuploads%2F94NQidqmQJQtDmNWlCrg%2Fimage.png?alt=media&amp;token=698a59a5-d896-4a5c-ae63-4cc4b5a0a619" alt=""><figcaption><p><code>Revenues</code> Variable before rearranging</p></figcaption></figure>

We set up our `Widgets sold` Variable so that we need to enter [**Assumptions**](/assumptions/introduction-to-assumptions) for 2021 and 2022 <mark style="color:green;">**(3)**</mark>, and from 2023 onwards `Widgets sold` will be equal to the previous period <mark style="color:green;">**(4)**</mark>. However, we don't know how many Widgets were sold in 2021 and 2022, so we cannot initially calculate `Revenues`, meaning we have blank values in our output <mark style="color:green;">**(5)**</mark>.

<figure><img src="https://2847533834-files.gitbook.io/~/files/v0/b/gitbook-x-prod.appspot.com/o/spaces%2FVy65sax6FVoNo2UTlJ0x%2Fuploads%2FHBG1yozAYdCW0U1ZrZNV%2Fimage.png?alt=media&amp;token=95016b58-977c-45c8-9d96-0da62dd1b501" alt=""><figcaption><p><code>Widgets sold</code> Variable before rearranging</p></figcaption></figure>

## Entering Actual Revenues

We know what our revenues were for 2021 and 2022, so we create a [**new Time Segment**](/variables/time-segments/time-segment-setup#creating-editing-time-segments) in our `Revenues` Variable <mark style="color:green;">**(6)**</mark>, with an `Assumptions` [**formula type**](/variables/time-segments/time-segment-setup#formula), and add our historical revenues data to this Time Segment.

<figure><img src="https://2847533834-files.gitbook.io/~/files/v0/b/gitbook-x-prod.appspot.com/o/spaces%2FVy65sax6FVoNo2UTlJ0x%2Fuploads%2FiMkMKBD78ZGwDQsFvlLF%2Fimage.png?alt=media&amp;token=e51edf79-2e77-4840-90e0-f4f135e1fb93" alt=""><figcaption><p><code>Revenues</code> Variable after entering Assumptions for 2021 and 2022</p></figcaption></figure>

Models now sees that for 2021 and 2022, it is expecting input data for all three Variables, `Revenues`, `Widgets sold` and `Price`. This is not a valid state, as in any [**Calculation**](/calculations/introduction-to-calculations) there must be exactly one unknown Variable to be calculated, otherwise there is the potential for conflicts (i.e. we could enter values for the three Variables that do not match the Calculation `Revenues = Widgets sold * Price`).

To rectify this, Models displays a message on the first Time Segment of `Revenues` <mark style="color:green;">**(7)**</mark>, warning that a "Child needs to be rearranged for this segment". We can read this as saying that one of the input Variables, `Widgets Sold` or `Price` needs to become the output of the Calculation to maintain logical consistency.

## Rearranging

To rearrange the segment, we simply click the **Resolve** <img src="https://2847533834-files.gitbook.io/~/files/v0/b/gitbook-x-prod.appspot.com/o/spaces%2FVy65sax6FVoNo2UTlJ0x%2Fuploads%2FcfiFcrjifcyFrvZezxKW%2Fimage.png?alt=media&amp;token=76e206a2-3b63-4891-b776-14213c92812a" alt="" data-size="line">button <mark style="color:green;">**(8)**</mark>, which opens a new dialog, shown below.

We are offered a choice of child Variables to rearrange. We need to select the Variable that we want to be used as the new output of the Time Segment. In this case, we know the price, but we don't know the number of widgets sold, so we select `Widgets sold` as the new output <mark style="color:green;">**(9)**</mark>.

<figure><img src="https://2847533834-files.gitbook.io/~/files/v0/b/gitbook-x-prod.appspot.com/o/spaces%2FVy65sax6FVoNo2UTlJ0x%2Fuploads%2F94VWa6cVsf6c2qQMR6SV%2Fimage.png?alt=media&amp;token=bd290cd0-d441-480e-a832-8fceb5c56e6e" alt=""><figcaption><p>Rearranging dialog</p></figcaption></figure>

This results in the below state, where we no longer have warnings in our Variables. The first Time Segment for `Widgets sold` has been rearranged, with a Calculation of `Revenues / Price` <mark style="color:green;">**(10)**</mark>.

<figure><img src="https://2847533834-files.gitbook.io/~/files/v0/b/gitbook-x-prod.appspot.com/o/spaces%2FVy65sax6FVoNo2UTlJ0x%2Fuploads%2FbRf3HylQVCjSEyiMqWeB%2Fimage.png?alt=media&amp;token=98d61ff3-409f-4e54-93ea-5b0cbef71121" alt=""><figcaption><p><code>Widgets sold</code> Variable after rearranging</p></figcaption></figure>

`Widgets sold` is now calculated from `Revenues` and `Price` for 2021 and 2022, and is static thereafter.&#x20;

{% hint style="info" %}
Note that the **Values** table visually indicates the change in calculation method with a border to the right of the 2022 period <mark style="color:green;">**(11)**</mark>.
{% endhint %}


# Rearranging Tips

## Cascading rearranged Variables

In the [**previous section's**](/rearranging/rearranging-example) simple walkthrough, we only have three Variables, `Revenues`, `Widgets sold`, and `Price`.

Most situations are more complex than this: for instance, take the example below, where `Widgets sold` incorporates an inflation Calculation (`Widgets sold = Widgets sold [-1] * (1 + Widget sales yearly increase)`.&#x20;

<figure><img src="https://2847533834-files.gitbook.io/~/files/v0/b/gitbook-x-prod.appspot.com/o/spaces%2FVy65sax6FVoNo2UTlJ0x%2Fuploads%2FAs2yCx0jpKqsSQaE6Grd%2Fimage.png?alt=media&amp;token=d3136421-b9eb-4e93-b1ed-53a96a8cb43a" alt=""><figcaption><p><code>Revenues</code> Variable before rearranging</p></figcaption></figure>

We see the same warning in the `Revenues` as previously <mark style="color:green;">**(1)**</mark>: we need to rearrange a child. However, this time, when we rearrange `Widgets sold`, we see a similar warning in `Widgets sold`, as shown below <mark style="color:green;">**(2)**</mark>.

<figure><img src="https://2847533834-files.gitbook.io/~/files/v0/b/gitbook-x-prod.appspot.com/o/spaces%2FVy65sax6FVoNo2UTlJ0x%2Fuploads%2FK8NUjxGWedQJ618NofAm%2Fimage.png?alt=media&amp;token=8b63054f-0fa9-4926-9805-331ff5090dea" alt=""><figcaption><p><code>Widgets sold</code> Variable after rearranging</p></figcaption></figure>

Models is telling us that now we are calculating `Widgets sold` from `Revenues` and `Price`, we cannot also calculate it from the inflation calculation. Therefore we must rearrange `Widget sales yearly increase`, which can be calculated from the actual values of `Widgets sold` in 2021 and 2022.

This results in the below output with `Widget sales yearly increase` also rearranged <mark style="color:green;">**(3)**</mark>.

<figure><img src="https://2847533834-files.gitbook.io/~/files/v0/b/gitbook-x-prod.appspot.com/o/spaces%2FVy65sax6FVoNo2UTlJ0x%2Fuploads%2FVcjKt7EBadtaFTm4CLFl%2Fimage.png?alt=media&amp;token=b72160cb-d95a-48a7-880d-eba245af8b90" alt=""><figcaption><p><code>Widget sales yearly increase</code> after rearranging</p></figcaption></figure>

In this way, rearranged Variables cascade down to the "bottom" of the Model, or the point at which there are no more Calculations to rearrange.

## Reversing relationships

Models allows you to quickly change the direction of calculation flows if you change the desired output of a Model.

Take the below example, where we have set our Model up with `Revenue` as the output from the two input Variables, `Widgets sold` and `Price`.

<figure><img src="https://2847533834-files.gitbook.io/~/files/v0/b/gitbook-x-prod.appspot.com/o/spaces%2FVy65sax6FVoNo2UTlJ0x%2Fuploads%2FKTuTtcMoiJ2AXAnWMJHh%2Fimage.png?alt=media&amp;token=9444043f-545c-4288-827a-ad6246279a99" alt=""><figcaption><p><strong>Reverse relationship</strong> button</p></figcaption></figure>

If we select both <mark style="color:green;">**(1)**</mark> the `Revenues` Variable, and one of its child Variables (in the example above, `Widgets sold`), we are offered the option to reverse their relationship, using the **Reverse relationship** button <mark style="color:green;">**(2)**</mark>.

This results in the below:

<figure><img src="https://2847533834-files.gitbook.io/~/files/v0/b/gitbook-x-prod.appspot.com/o/spaces%2FVy65sax6FVoNo2UTlJ0x%2Fuploads%2F9nirbWdJv11gYqo8Kqur%2Fimage.png?alt=media&amp;token=091bed5e-15b2-4fb1-865b-5360bed66776" alt=""><figcaption><p><code>Widgets sold</code> Variable after reversing relationship with <code>Revenues</code></p></figcaption></figure>

<figure><img src="https://2847533834-files.gitbook.io/~/files/v0/b/gitbook-x-prod.appspot.com/o/spaces%2FVy65sax6FVoNo2UTlJ0x%2Fuploads%2FKwmb1j2lrlbOOzlwTNNE%2Fimage.png?alt=media&amp;token=35326166-c4f8-4c81-a8ac-85a61522c0f7" alt=""><figcaption><p><code>Revenues</code> Variable after reversing relationship with <code>Widgets sold</code></p></figcaption></figure>

`Widgets sold` has been converted to a Calculation Variable with Calculation `Revenues / Price` <mark style="color:green;">**(3)**</mark>. `Revenues` has been converted to an Assumptions Variable where the second Time Segment is now rearranged <mark style="color:green;">**(4)**</mark> to its original Calculation of `Price * Widgets sold`.


# Introduction to Cases

How to use Scenarios and Sensitivities to test your Model

## Overview

We often want to test how our [**Model**](/models/home-tab) outputs change for different values of inputs. What would be the impact of raising the price of a product? What would happen if our product launch was delayed by 6 months?

To do this, we can use **Scenarios** and **Sensitivities**:

<table data-header-hidden><thead><tr><th width="247">Version component</th><th>Details</th></tr></thead><tbody><tr><td><strong>Scenario</strong></td><td><p>A <strong>Scenario</strong> usually reflects some kind of "alternative reality" for your Model, perhaps to reflect decisions that need to be made, and may involve significant changes.</p><p></p><p><em>e.g. turning a revenue item on or off, or switching between insourcing and outsourcing a cost activity</em></p></td></tr><tr><td><strong>Sensitivity</strong></td><td>A <strong>Sensitivity</strong> is usually used to test how the outputs of a Model are affected by changes to the inputs, reflecting uncertainty in our assumptions.<br><br><em>e.g. testing the impact of a range of inflation rates</em></td></tr></tbody></table>

Models automatically calculates all combinations of Scenarios and Sensitivities and, unlike Excel, can easily display several Scenarios or Sensitivities simultaneously, as in the example screenshot below, enabling efficient analysis of your Model dynamics.

<figure><img src="https://2847533834-files.gitbook.io/~/files/v0/b/gitbook-x-prod.appspot.com/o/spaces%2FVy65sax6FVoNo2UTlJ0x%2Fuploads%2FceGzIrYlIEClNYD174EV%2Fimage.png?alt=media&amp;token=d81879a9-6e18-433a-a737-65cd4fc9af02" alt=""><figcaption><p>Chart showing three Sensitivities</p></figcaption></figure>

{% hint style="info" %}
We call each combination of a Scenario and Sensitivity a **Case**.
{% endhint %}

## How Scenarios and Sensitivities work in Models

Scenarios and Sensitivities both affect the values of Assumptions in your Model. For each Scenario/Sensitivity in the Model, you can apply a value for each Assumption.

In the below example, there are two Scenarios (`Base` and `Lean`), and three Sensitivities (`Base`, `Low`, and `High`).

In this case, the `Lean` Scenario is configured to take its value from the `Base` Scenario by default, unless a value is specified for `Lean` <mark style="color:green;">**(1)**</mark>.  This means that a value must be present in the `Base` Scenario for all Assumptions.

Sensitivities do not need to have a value specified, in which case the value for the Assumption will be the unchanged Scenario value. In the case that a value is specified <mark style="color:green;">**(2)**</mark>, the Scenario value will be modified appropriately.

<figure><img src="https://2847533834-files.gitbook.io/~/files/v0/b/gitbook-x-prod.appspot.com/o/spaces%2FVy65sax6FVoNo2UTlJ0x%2Fuploads%2FbdrUoR1Lyrb8W5IzdMn1%2Fimage.png?alt=media&amp;token=a5b2c183-a727-446d-84fe-38a56820b5ea" alt=""><figcaption><p>Scenario and Sensitivity values in Assumptions</p></figcaption></figure>

The next sections explain how to set up Scenarios and Sensitivities, and the various ways in which they can be used.

## How to change active Scenario and Sensitivity

[**Variable**](/variables/variable-basics) previews and [**Dashboard**](/dashboards/dashboards-basics) items will by default display values for the currently active Scenario and Sensitivity. You can change this in the Model Settings bar at the top of the [**Model Editor**](/models/model-editor). Just click on one of the Scenario or Sensitivity buttons, as shown in the screenshot below, to activate it.

<figure><img src="https://2847533834-files.gitbook.io/~/files/v0/b/gitbook-x-prod.appspot.com/o/spaces%2FVy65sax6FVoNo2UTlJ0x%2Fuploads%2FODr5BxKtb8WZ4bnIWW7R%2Fimage.png?alt=media&amp;token=ec9d436e-9067-4048-b3a6-9470cae3e014" alt=""><figcaption><p>Controls for changing active Scenario/Sensitivity </p></figcaption></figure>


# Managing Scenarios

How to configure Scenarios

## Scenario Wizard

<figure><img src="https://2847533834-files.gitbook.io/~/files/v0/b/gitbook-x-prod.appspot.com/o/spaces%2FVy65sax6FVoNo2UTlJ0x%2Fuploads%2FLeh4mWXJvfQm72EG9ji5%2Fimage.png?alt=media&amp;token=a9896f79-43a0-4388-991a-df47680756d5" alt="Screenshots showing the Edit Scenarios button in the Model Settings ribbon, and the Scenarios wizard that opens when it is pressed." width="563"><figcaption><p>Scenario editor</p></figcaption></figure>

You can create Scenarios by clicking the **Edit** button <mark style="color:green;">**(1)**</mark> in the Scenarios section of the **Model Settings** area of the [**Model Editor**](/models/model-editor).

This will open a wizard <mark style="color:green;">**(2)**</mark> in which you can view, edit and create Scenarios.

When creating a Scenario, you can select another Scenario on which to base the new one. In the above example, the `Lean` Scenario is based on the `Base` Scenario. This means that if a value isn't specified for an Assumption for the `Lean` Scenario, its value will be taken from the `Base` Scenario.

{% hint style="info" %}
If you do not specify a "based on" Scenario, you will need to specify a value for every Assumption for the new Scenario
{% endhint %}

## Entering Scenario values

### In the Assumptions wizard

You can enter values for different Scenarios in the [**Assumptions wizard**](/assumptions/assumptions-wizard). To do so you will need to first select the Scenarios that you want to edit, in the **Setup step** <mark style="color:green;">**(1)**</mark>. The **Values step** will then include all selected Scenarios in the values input table <mark style="color:green;">**(2)**</mark>, where you can edit them freely.

<figure><img src="https://2847533834-files.gitbook.io/~/files/v0/b/gitbook-x-prod.appspot.com/o/spaces%2FVy65sax6FVoNo2UTlJ0x%2Fuploads%2FKsMvOukjBJA4np0b1NYi%2Fimage.png?alt=media&amp;token=0a158bc8-1d69-40d5-abb2-cf22d6c4ac74" alt=""><figcaption><p>Editing Scenario values in the Assumptions wizard</p></figcaption></figure>

### In the Assumptions list

You can edit Scenario values directly in the Assumptions list in the Assumptions tab of the [**Model Editor**](/models/model-editor).

Just click in the value you would like to edit <mark style="color:green;">**(1)**</mark>, enter a new value, and press **Enter** to save. You can delete a Scenario value using the delete button <mark style="color:green;">**(2)**</mark>, or by deleting the value and pressing **Enter**.

<figure><img src="https://2847533834-files.gitbook.io/~/files/v0/b/gitbook-x-prod.appspot.com/o/spaces%2FVy65sax6FVoNo2UTlJ0x%2Fuploads%2FOKVQHqKA5aJPK3zqlT99%2Fimage.png?alt=media&amp;token=86fbb468-a35c-4daf-a15b-acee8fed8eee" alt=""><figcaption><p>Editing Scenario values in the Assumptions list</p></figcaption></figure>


# Managing Sensitivities

How to configure Sensitivities

## Sensitivity Wizard

<figure><img src="https://2847533834-files.gitbook.io/~/files/v0/b/gitbook-x-prod.appspot.com/o/spaces%2FVy65sax6FVoNo2UTlJ0x%2Fuploads%2FBtWGUpcrLjHcfcRSURq9%2Fimage.png?alt=media&amp;token=9a86b9f7-e519-401f-bf6f-aae8d8a8bdd9" alt="Screenshot of the Edit Sensitivities button, and the wizard that it opens" width="563"><figcaption><p>Sensitivity Editor</p></figcaption></figure>

You can create Sensitivities by clicking the **Edit** button <mark style="color:green;">**(1)**</mark> in the Sensitivities section of the **Model Settings** area of the [**Model Editor**](/models/model-editor).

This will open a wizard <mark style="color:green;">**(2)**</mark> in which you can view, edit and create Sensitivities.

When creating a Sensitivity, you can optionally select another Sensitivity on which to base the new one. In this case, the new Sensitivity would take its values from the Sensitivity on which it is based, unless a value is specified. In the above example, all Sensitivities are independent from one another.

## Editing Sensitivity values

### In the Assumptions Wizard

You can edit values for Sensitivities in the [**Assumptions Wizard**](/assumptions/assumptions-wizard). In the **Sensitivities step**, you can change the way in which the Sensitivity is applied <mark style="color:green;">**(1)**</mark>, and add/edit Sensitivity values in the entry table <mark style="color:green;">**(2)**</mark>. Note that all Sensitivity values can be left blank.

See the [**Sensitivity Values documentation**](/assumptions/assumptions-wizard/sensitivity-values) to understand how the different Sensitivity Types work.

<figure><img src="https://2847533834-files.gitbook.io/~/files/v0/b/gitbook-x-prod.appspot.com/o/spaces%2FVy65sax6FVoNo2UTlJ0x%2Fuploads%2F8cA1fydg9K66MRtmZ6hY%2Fimage.png?alt=media&amp;token=dc591940-ca0b-498b-b46f-c23592da76bf" alt=""><figcaption><p>Editing Sensitivity values in the Assumptions dialog</p></figcaption></figure>

### In the Assumptions list

You can edit Sensitivity values directly in the Assumptions list in the Assumptions tab of the [**Model Editor**](/models/model-editor).

Just click in the value you would like to edit <mark style="color:green;">**(1)**</mark>, enter a new value, and press **Enter** to save. You can delete a Sensitivity value using the delete button <mark style="color:green;">**(2)**</mark>, or by deleting the value and pressing **Enter**.

<figure><img src="https://2847533834-files.gitbook.io/~/files/v0/b/gitbook-x-prod.appspot.com/o/spaces%2FVy65sax6FVoNo2UTlJ0x%2Fuploads%2F86Duz12uLD95cDyyK4J0%2Fimage.png?alt=media&amp;token=aacd19a2-0341-4562-a42b-c81a479b827b" alt=""><figcaption><p>Editing Sensitivity values in the Assumptions tab</p></figcaption></figure>


# Generating Excel

Introduction to generating Excel with Models

## Overview

You can generate an Excel spreadsheet from your Model at the click of a button.

These spreadsheets are:

* Free of copy/paste formula errors
* Neatly and consistently formatted
* Fully-working and dynamic, allowing your colleagues and clients to explore your model without needing access to the Models software

## Layouts

To generate Excel, you first need to create a **Layout**. The Layout tells Models where you want the various parts of your Model ([**Variables**](/variables/variable-basics), [**Assumptions**](/assumptions/introduction-to-assumptions), [**Dashboards**](/dashboards/dashboards-basics) etc.) to appear in your spreadsheet.

Your Model's Layout is independent of the Calculation structure - so unlike in Excel, moving things around in the Layout can't affect any of the Calculations being performed. This means you can quickly edit the layout of your spreadsheet, without needing to worry about breaking a formula. Instead, you can focus on improving the readability of the spreadsheet, or whatever is important for your particular project.

That said, you do need to make sure that you have included all components of a Calculation in the Layout for the Calculation to be performed. If your Layout is missing a part of a Calculation tree (any Variables and Assumptions on which the Calculation is dependent), the spreadsheet will still be generated, but you will see warnings where components are missing.

{% hint style="info" %}
You can add the same Variable to the Layout multiple times. A calculation formula will only be created in the first instance of the Variable; subsequent instances will reference the first instance.
{% endhint %}

{% hint style="warning" %}
Currently, you can only create one Layout per Model. We may add the ability to create multiple Layouts in future updates (e.g. so that you can include/exclude parts of the Model depending on audience) - let us know if you would be interested in this feature.
{% endhint %}

## Layout Views

Models provides two views for examining your Excel layout, Spreadsheet view (left) and Logical view (right).

<figure><img src="https://2847533834-files.gitbook.io/~/files/v0/b/gitbook-x-prod.appspot.com/o/spaces%2FVy65sax6FVoNo2UTlJ0x%2Fuploads%2F1jEQbL4lO4qoxmrOnlKr%2Fimage.png?alt=media&amp;token=5d9c467b-4fe0-4d1d-8348-7fc8856fd70b" alt="Screenshot of the two views for Excel layouts"><figcaption><p>Excel layout views</p></figcaption></figure>

### Spreadsheet view (default)

This view shows a representation of how your generated Excel will look, including all calculated values, and borders, bold/italic text (note, it does not show how the selected [**Model Theme**](/layout/excel-formatting/excel-themes-and-styles) will look).

Values representing assumptions (with a green background) can be edited directly in this view.

### Logical view

This view shows simplified [**Line Groups**](/layout/sheets/sheet-content#line-groups) and Variables but does not show any calculated values. This view is helpful when reorganising a sheet and allows quick rearranging of items.

## Creating your Layout Automatically

Models provides an easy way of adding multiple items to the Layout in a logical fashion with just a few button clicks. Details are on the [**next page**](/layout/auto-layout).

## Creating your Layout Manually

Models provides two main methods of creating and editing your Layout manually:

1. From within the **Sheets tab** of the [**Model Editor**](/models/model-editor). Here you can easily see all of the items in each [**Sheet**](/layout/sheets) and edit them directly.

<figure><img src="https://2847533834-files.gitbook.io/~/files/v0/b/gitbook-x-prod.appspot.com/o/spaces%2FVy65sax6FVoNo2UTlJ0x%2Fuploads%2FPG0KOsZrWsh2G7YEOmL7%2Fimage.png?alt=media&amp;token=7e591fd5-807a-44f3-a475-c63ee3eb88a4" alt="Screenshot of the Sheets tab with contents of the sheet displayed in a treeview" width="563"><figcaption><p>The <strong>Sheets tab</strong></p></figcaption></figure>

2. By adding items directly to the Layout from the [**Variables**](/variables/variable-basics), [**Assumptions**](/assumptions/introduction-to-assumptions) and [**Metrics**](/metrics/metrics) tabs. Here you can add items to the Layout as you create them without needing to leave your workflow.

<figure><img src="https://2847533834-files.gitbook.io/~/files/v0/b/gitbook-x-prod.appspot.com/o/spaces%2FVy65sax6FVoNo2UTlJ0x%2Fuploads%2Fa1z5JIcyWEDd4lwy9W0H%2Fimage.png?alt=media&amp;token=2ce9b7c8-f6f4-4a87-81e5-12e5fa546ed5" alt="Screenshot of Variables list view, with &#x22;Add to sheet&#x22; buttons showing on Variable items that haven&#x27;t been added to the layout."><figcaption><p><strong>Add to sheet</strong> buttons in the <strong>Variables tab</strong></p></figcaption></figure>

The next sections provide more detail of how to build and edit your Layout.


# Auto Layout

How to automatically add sections of your Model to the Layout

## How to use the Auto Layout feature

To automatically add Variables to your Layout, simply select one or more Variables. As shown below <mark style="color:green;">**(1)**</mark>, you only need to select the top node of any logical tree of Variables - Models will ensure that any Variables that the selected Variable depends upon will also be added to the Layout.

With the Variable selected, simply press the "Auto layout" button <mark style="color:green;">**(2)**</mark>. This brings up a wizard with one page

<figure><img src="https://2847533834-files.gitbook.io/~/files/v0/b/gitbook-x-prod.appspot.com/o/spaces%2FVy65sax6FVoNo2UTlJ0x%2Fuploads%2F45LjrNA4O9HMHrMO1w0D%2Fimage.png?alt=media&amp;token=8fa35f67-b7ab-4d6d-806c-b2a2f95be985" alt=""><figcaption><p>Steps 1 and 2 of using the Auto Layout feature</p></figcaption></figure>

### The Auto Layout wizard

<figure><img src="https://2847533834-files.gitbook.io/~/files/v0/b/gitbook-x-prod.appspot.com/o/spaces%2FVy65sax6FVoNo2UTlJ0x%2Fuploads%2FIkkOrAjA2iCMZlLEyhuG%2Fimage.png?alt=media&amp;token=9f6c4d15-3393-49cc-b49b-89b3ddce0b60" alt="Screenshot of the Auto Layout wizard"><figcaption><p>The Auto Layout wizard</p></figcaption></figure>

The Auto Layout wizard has only one mandatory field, which is the choice of **Calculations Sheet**. This is the sheet which all [**Variables**](/variables/variable-basics) within the selected node will be added to.

There are several *optional* fields which can be used to change how the layout is created as follows:

<table><thead><tr><th width="248">Optional Field</th><th>Description</th></tr></thead><tbody><tr><td>Calculations Line Group</td><td>If you want to add new content to an existing Line Group, select a Line Group here. If no Line Group is selected, new content will be added to the top level of the selected Sheet.</td></tr><tr><td>Assumptions Sheet</td><td>If you want to add Assumptions to a specific sheet, select one here. Otherwise Models will use the first Assumptions sheet it finds, or create one if none exists.</td></tr><tr><td>Assumptions Line Group</td><td>Select if you want to add new Assumptions content to an existing Line Group. If none selected, new content will be added to the top level of the selected Assumptions sheet.</td></tr><tr><td>Add Flags to separate sheet (toggle)</td><td>Flags are any Variable using the Boolean <a href="/data-types/data-types"><strong>Data Type</strong></a> (i.e. with TRUE/FALSE values), often used for settings timings of Variables (e.g. start period, end period). It is often good practice to place Flags on a separate sheet from other calculations - select this option if you want to do so.</td></tr><tr><td>Flags Sheet</td><td>If the <em>Add Flags to separate sheet</em> toggle is selected, you will be prompted to choose a Sheet to add Flags to.</td></tr><tr><td>Flags Line Group</td><td>Select if you want to add new Flags content to an existing Line Group. If none selected, new content will be added to the top level of the selected Flags sheet.</td></tr><tr><td>Max levels</td><td>Sets the maximum level of nesting of groups within a Sheet. We recommend a maximum nesting of 3 for most Models - higher levels of nesting add more "structure", but make worksheets less readable.</td></tr><tr><td>Ideal min groups at level / Ideal max groups at level</td><td>Controls the way in which nested Line Groups are created. Models will try to ensure that Line Groups contain a number of child groups between the min and max values set here.<br><br>Increasing the <em>min groups at level</em> setting will result in more Line Groups at higher levels, and fewer groups at lower levels.</td></tr></tbody></table>


# Sheets

How to create Sheets in a Layout

## Overview

Just like in Excel, Layouts in Models are divided into Sheets. Each Sheet in Models represents a sheet that will be generated in Excel.

There are 5 types of Sheet that you can create:

<table><thead><tr><th width="235">Sheet type</th><th>Details</th></tr></thead><tbody><tr><td><code>Assumptions</code></td><td>Contains <a href="/assumptions/introduction-to-assumptions"><strong>Assumptions</strong></a>. All inputs to the Model will be editable from an Assumptions sheet, unless they are linked to a <a href="/dashboards/dashboards-basics"><strong>Dashboard</strong></a> or <a href="/excel-inserts-and-outputs/excel-inserts"><strong>Excel Insert</strong></a>.</td></tr><tr><td><code>Calculations</code></td><td>Contains <a href="/variables/variable-basics"><strong>Variables</strong></a>. </td></tr><tr><td><code>Metrics</code></td><td>Contains <a href="/metrics/metrics"><strong>Metrics</strong></a>.</td></tr><tr><td><code>Dashboard</code></td><td>Contains a <a href="/dashboards/dashboards-basics"><strong>Dashboard</strong></a>. Each Dashboard sheet can only display one Dashboard.</td></tr><tr><td><code>Excel Insert</code></td><td>Copy of a pre-built sheet from another spreadsheet (e.g. a cover sheet). Read more about Excel Inserts <a href="/excel-inserts-and-outputs/excel-inserts"><strong>here</strong></a>.</td></tr></tbody></table>

{% hint style="info" %}
You can only have one type of item (Assumptions, Variables, Metrics or Dashboards) on each Sheet in the Layout.
{% endhint %}

### Auto-generated Sheets

Depending on your Model, some auto-generated Sheets may be added to your Layout. For instance, if any of your Variables use Dimensions, a `Dimensions` Sheet will be added.&#x20;

These Sheets:

* **Can** be moved
* **Can** be [**hidden**](#hide-sheet-in-excel), or have their [**tab color**](#tab-color) changed
* **Cannot** be deleted

## Sheet Setup page

Sheets can be created directly in the **Sheets tab** of the [**Model Editor**](/models/model-editor), or from within any Sheet selector (e.g. in an **Add Item wizard**).

{% hint style="info" %}
Depending on the type of sheet you are creating, and which part of the UI you are creating it from, you will see different pages in the Sheet wizard. For `Dashboard` and `Excel Insert` sheets, for instance, you will see pages allowing you to choose the items to show on the sheet.
{% endhint %}

All sheet dialogs contain the **Setup page**, which will look similar to the below:

<figure><img src="https://2847533834-files.gitbook.io/~/files/v0/b/gitbook-x-prod.appspot.com/o/spaces%2FVy65sax6FVoNo2UTlJ0x%2Fuploads%2F1gxGDX99GQjqIg3TXKK9%2Fimage.png?alt=media&amp;token=e942dada-8255-4d34-b0b3-3b9c64ce47b1" alt="Screenshot of the new Sheet setup step" width="563"><figcaption><p>Sheet <strong>Setup page</strong></p></figcaption></figure>

### Sheet name

Each sheet must have a name that meets Excel [**sheet name rules**](https://support.microsoft.com/en-us/office/rename-a-worksheet-3f1f7148-ee83-404d-8ef0-9ff99fbad1f9). If you enter a name that has already been used elsewhere in your Layout, Models will automatically change it.

### Sheet description (Optional)

Adds a description to the Sheet when generated, shown in the top left of the sheet, as below.

<figure><img src="https://2847533834-files.gitbook.io/~/files/v0/b/gitbook-x-prod.appspot.com/o/spaces%2FVy65sax6FVoNo2UTlJ0x%2Fuploads%2FOTv0dMMDbiwuNciwoxL9%2Fimage.png?alt=media&amp;token=723ee08d-aaf5-4fc6-8c7e-42c2e23bd0d7" alt=""><figcaption><p>Sheet description</p></figcaption></figure>

### Time period (Calculation sheets only)

Specifies whether the Sheet's time period is the default period of the Model (as defined in [**Timings**](/models/home-tab/creating-a-model/timings)) or an aggregated time period.&#x20;

If you have [**Variables**](/variables/variable-basics) that are [**aggregated**](/variables/variable-basics/variable-setup#time-period) over several time periods (e.g. in a quarterly Model, you may have a Variable that sums up totals for each year), these must be placed on a dedicated Sheet with the appropriate time period.

{% hint style="warning" %}
Each sheet can only show one type of time period e.g. you cannot have a Sheet that shows both quarterly and annual periods
{% endhint %}

### Control sheet

One Sheet in the Model must display the dropdown controls for selecting the active Scenario and Sensitivity, as shown below.

<figure><img src="https://2847533834-files.gitbook.io/~/files/v0/b/gitbook-x-prod.appspot.com/o/spaces%2FVy65sax6FVoNo2UTlJ0x%2Fuploads%2FmmocxOZ3ruKzhwpaXa13%2Fimage.png?alt=media&amp;token=855619bd-db4e-499c-8e59-ac3ffcef853b" alt=""><figcaption><p>Sheet with dropdown controls for Scenario and Sensitivity</p></figcaption></figure>

Use the toggle to specify whether this Sheet will display these controls. If you select this option on one Sheet, it will be deselected on all other Sheets.

### Group levels

You can specify a number of levels to group your [**Line Groups**](/layout/sheets/sheet-content#line-groups-and-lines) by in your generated spreadsheet. By default, the value is `0`, meaning no Excel grouping is performed.

{% hint style="info" %}
Use grouping on large or complex Sheets to help speed up navigation of the Excel.
{% endhint %}

<figure><img src="https://2847533834-files.gitbook.io/~/files/v0/b/gitbook-x-prod.appspot.com/o/spaces%2FVy65sax6FVoNo2UTlJ0x%2Fuploads%2FQY1C38WgF1uk7Eh19tHv%2Fimage.png?alt=media&amp;token=567578a6-5076-4904-88ba-56b1ea0f4e13" alt=""><figcaption><p>Generated spreadsheet with 2 levels of grouping</p></figcaption></figure>

### Hide sheet in Excel

If this item is selected, the Sheet will be [**hidden**](https://support.microsoft.com/en-us/office/hide-or-unhide-worksheets-69f2701a-21f5-4186-87d7-341a8cf53344) in Excel.

### Tags

You can apply [**Tags**](/tags/introduction-to-tags) to your Sheet to help search Sheets in large Layouts.

### Tab color

You can select a color for your Sheet, which will be used to change the color of its tab in Excel, as shown below.

<figure><img src="https://2847533834-files.gitbook.io/~/files/v0/b/gitbook-x-prod.appspot.com/o/spaces%2FVy65sax6FVoNo2UTlJ0x%2Fuploads%2FVv50wM4gMIdd8eqNWTtK%2Fimage.png?alt=media&amp;token=eb84be95-3552-47c4-85f0-797beaa878a5" alt=""><figcaption><p>Sheets with edited tab colors</p></figcaption></figure>


# Sheet Content

What content do Sheets contain?

## Line Groups and Line Items

[**Variables**](/variables/variable-basics), [**Assumptions**](/assumptions/introduction-to-assumptions) and [**Metrics**](/metrics/metrics) are all added to Sheets via [**Line Groups**](#line-groups) and [**Line Items**](#line-items).

<figure><img src="https://2847533834-files.gitbook.io/~/files/v0/b/gitbook-x-prod.appspot.com/o/spaces%2FVy65sax6FVoNo2UTlJ0x%2Fuploads%2Fj7KELxl7duB9sJsNDSmG%2Fimage.png?alt=media&amp;token=a249845d-f464-46ee-856d-c781ccac1bc7" alt=""><figcaption><p>Line Groups and Line Items in Models (left) and Excel (right)</p></figcaption></figure>

### Line Items

All Variables, Assumptions and Metrics in your Layout are represented by a Line Item. As shown in the screenshot above, when a Variable or Metric has a [**Dimension**](/dimensions/introduction-to-dimensions) applied (the Variable `Gym members` in the example), you only need to add a single item to the Layout for all child items, and the summary line, to be generated in the Excel.

### Line Groups

Each [**Line Item**](#line-items) must be a child of a **Line Group**. Line Groups can be added to other Line Groups in a tree-like structure, and numbering will be automatically added, as in the example screenshots above.

## Dashboards

`Dashboard` Sheets contain a reference to a single [**Dashboard**](/dashboards/dashboards-basics). In the [**Sheet wizard**](/layout/sheets#sheet-setup-step), if you select the `Dashboard` Sheet type, you will be shown a step in which you can choose a Dashboard to display. Only one Dashboard can be shown on any single Sheet.


# Adding and Editing Content

How to edit Sheet content

## Adding Line Items

### Adding from item lists&#x20;

From any [**Variables**](/variables/variable-basics), [**Assumptions**](/assumptions/introduction-to-assumptions) and [**Metrics**](/metrics/metrics) list, you can add items directly to the Layout, as shown below. An **Add to layout** button will appear <mark style="color:green;">**(1)**</mark> when any items are selected. An **Add to sheet** button is also available on the Variable itself <mark style="color:green;">**(2)**</mark> - this button will only be shown if the Variable has not been added to the Layout yet.

<figure><img src="https://2847533834-files.gitbook.io/~/files/v0/b/gitbook-x-prod.appspot.com/o/spaces%2FVy65sax6FVoNo2UTlJ0x%2Fuploads%2FwQqrpymcMzK9qfpScuFL%2Fimage.png?alt=media&amp;token=5adaab86-ee66-4ddd-982d-75edf5981ac8" alt="Screenshots showing Add to Sheet buttons in the Variables view (left) and Metrics view (right)"><figcaption><p><strong>Add to sheet</strong> buttons in the <strong>Variables</strong> and <strong>Metrics</strong> tab4</p></figcaption></figure>

Pressing one of these buttons will open an **Add Item to Layout wizard**, as shown in the screenshots below. Select a [**Sheet**](/layout/sheets) <mark style="color:green;">**(1)**</mark>, and a [**Line Group**](/layout/sheets/sheet-content#line-groups) to add the items to <mark style="color:green;">**(2)**</mark>. Line Groups can be added and edited as desired in the **Line Group step**.

{% hint style="info" %}
The **Sheet step** will only show Sheets of the correct item type. If you add a new Sheet here, it will automatically be of the correct type.
{% endhint %}

<figure><img src="https://2847533834-files.gitbook.io/~/files/v0/b/gitbook-x-prod.appspot.com/o/spaces%2FVy65sax6FVoNo2UTlJ0x%2Fuploads%2FjI7763owkvE6cmGtSt7K%2Fimage.png?alt=media&amp;token=ad9e41cd-c1cd-4b4f-b86d-17b49f8eed6a" alt=""><figcaption><p><strong>Add Item to Layout</strong> wizard</p></figcaption></figure>

#### Show/Hide Layout buttons

If you do not want to see **Add to sheet** buttons on the Variables themselves, you can hide them from the Menu, by navigating to **View > Show Layout buttons**, as shown below.

<figure><img src="https://2847533834-files.gitbook.io/~/files/v0/b/gitbook-x-prod.appspot.com/o/spaces%2FVy65sax6FVoNo2UTlJ0x%2Fuploads%2F8ZJFbhIcxuizEfZsWDC6%2Fimage.png?alt=media&amp;token=ce5ba557-e795-41ac-8dcf-f5a9c943f78b" alt=""><figcaption><p><strong>Show Layout buttons</strong> toggle</p></figcaption></figure>

### Adding in the Sheet preview

From any Sheet preview, as shown in the screenshot below, you can add items to a Line Group by selecting the Line Group and pressing the **Add items** button.

<figure><img src="https://2847533834-files.gitbook.io/~/files/v0/b/gitbook-x-prod.appspot.com/o/spaces%2FVy65sax6FVoNo2UTlJ0x%2Fuploads%2FV6ozyBEYyre8uhjUsBX7%2Fimage.png?alt=media&amp;token=1f1fbdcb-4f2c-4b51-9078-6e5796bbb36b" alt="Screenshot of a Sheet preview, with the Add Items to LineGroup button highlighted" width="563"><figcaption><p>Adding items from the Sheet preview</p></figcaption></figure>

## Adding Line Groups

From any Sheet preview, as shown in the screenshot below, you can add Line Groups by pressing the **New** button <mark style="color:green;">**(1)**</mark> - this will add a new Line Group to the bottom of the Sheet. If you select an existing Line Group, you can add a child Line Group directly, by pressing the **Add child group** button <mark style="color:green;">**(2)**</mark>.

<figure><img src="https://2847533834-files.gitbook.io/~/files/v0/b/gitbook-x-prod.appspot.com/o/spaces%2FVy65sax6FVoNo2UTlJ0x%2Fuploads%2FMdcC8yEn6IBj3ZnD7cfy%2Fimage.png?alt=media&amp;token=47c0b911-d918-4de5-840d-c2bb2c58bbc2" alt="Screenshot of a Sheet preview highlighted the New LineGroup button and the &#x22;Add Child Group&#x22; button" width="563"><figcaption><p>Adding Line Groups</p></figcaption></figure>

### The Line Group wizard

<figure><img src="https://2847533834-files.gitbook.io/~/files/v0/b/gitbook-x-prod.appspot.com/o/spaces%2FVy65sax6FVoNo2UTlJ0x%2Fuploads%2FH9QXTj4WQhwmV3QmKbL7%2Fimage.png?alt=media&amp;token=0e975954-6b1f-432f-8392-f95cbd59cbf9" alt=""><figcaption><p>The Line Group wizard</p></figcaption></figure>

The Line Group wizard, as shown in the screenshot above, allows you to enter a Name and some formatting options, as follows:

<table data-header-hidden><thead><tr><th width="281">Formatting option</th><th>Details</th></tr></thead><tbody><tr><td>Number of lines before/after header</td><td>Changes the number of blank lines inserted into the spreadsheet before and after the Line Group heading</td></tr><tr><td>Include header?</td><td>Specifies whether to include the header in the generated spreadsheet. In this way, you can use Line Groups to create custom spacing between items, without displaying a header.</td></tr></tbody></table>

## Editing in the Sheet preview

### Drag and Drop

The Sheet preview supports drag and drop to move single or multiple Items and Line Groups.

### Line Group level controls

When you hover over a Line Group, as shown in the screenshot below, buttons will appear that can be used to promote/demote the Line Group between levels.

<figure><img src="https://2847533834-files.gitbook.io/~/files/v0/b/gitbook-x-prod.appspot.com/o/spaces%2FVy65sax6FVoNo2UTlJ0x%2Fuploads%2FtFoCeMw1jZI7iNXQcuLc%2Fimage.png?alt=media&amp;token=30025828-02e3-4ccf-93bb-717723c5d4c5" alt=""><figcaption><p>Promote / demote controls</p></figcaption></figure>

### Item Previews

A full preview for any Sheet item (Variables, Assumptions, Metrics and Dashboards) can be seen by selecting that item in the Sheet preview. Editing the item from the Sheet preview will open a full editing wizard for that item, so you can make changes without needing to navigate away.


# Excel Formatting

How to change the appearance of your spreadsheets

## Overview

Models ensures that all of your generated spreadsheets are consistent in layout and style, and it uses formatting to provide visual indications of how the spreadsheet should be used.

### Cell styles

To format cells in Excel, Models uses Excel's built-in [**Cell Styles**](https://support.microsoft.com/en-us/office/apply-create-or-remove-a-cell-style-472213bf-66bd-40c8-815c-594f0f90cd22) feature, as shown in the screenshot below.

<figure><img src="https://2847533834-files.gitbook.io/~/files/v0/b/gitbook-x-prod.appspot.com/o/spaces%2FVy65sax6FVoNo2UTlJ0x%2Fuploads%2Fz8OFTi8mmHcGzas8bpRt%2Fimage.png?alt=media&amp;token=41a0702d-c89a-425c-9b20-fe9806f690a2" alt=""><figcaption><p>Cell styles in Excel</p></figcaption></figure>

Models adds styles to the spreadsheet and then applies these to different types of cells. Editing the style from within Excel changes all cells in the spreadsheet that have the style applied. The main styles that should be understood are listed in the table below.

<table><thead><tr><th width="166.33333333333331">Style</th><th>Details</th></tr></thead><tbody><tr><td><img src="https://2847533834-files.gitbook.io/~/files/v0/b/gitbook-x-prod.appspot.com/o/spaces%2FVy65sax6FVoNo2UTlJ0x%2Fuploads%2FOHiKZHPClspAlT0mVIpD%2Fimage.png?alt=media&amp;token=cd34f837-83b0-4133-9e26-77eb77227b32" alt="Control style" data-size="original"></td><td>The value of these cells can be changed at will. Typically used for Scenario and Sensitivity dropdowns.</td></tr><tr><td><img src="https://2847533834-files.gitbook.io/~/files/v0/b/gitbook-x-prod.appspot.com/o/spaces%2FVy65sax6FVoNo2UTlJ0x%2Fuploads%2FjnwYKvTgrcqkTMSwIEZM%2Fimage.png?alt=media&amp;token=3b00702b-0136-4f37-bbbd-a498066f4f95" alt="Input data style" data-size="original"></td><td>Input values to the Model. These cells should typically only be updated if you have better data than is currently present.</td></tr><tr><td><img src="https://2847533834-files.gitbook.io/~/files/v0/b/gitbook-x-prod.appspot.com/o/spaces%2FVy65sax6FVoNo2UTlJ0x%2Fuploads%2FVXnwIWLfV9RqiEzjAp57%2Fimage.png?alt=media&amp;token=46fdb632-ef76-49fa-b6d3-2d5bf4f7beb8" alt="Input Linked style" data-size="original"></td><td>Cells that are linked to input values. <a href="/variables/variable-basics/variable-setup#assumption-variables"><strong>Assumption Variables</strong></a> link to their Assumptions using this type of cell.</td></tr><tr><td><img src="https://2847533834-files.gitbook.io/~/files/v0/b/gitbook-x-prod.appspot.com/o/spaces%2FVy65sax6FVoNo2UTlJ0x%2Fuploads%2Fcjt5k3XWaHmRXJlPCeyR%2Fimage.png?alt=media&amp;token=67551cad-5cbf-437b-b3e2-6ac84a184193" alt="Calculation style" data-size="original"></td><td>Calculations. Most Variable cells look like this.</td></tr><tr><td><img src="https://2847533834-files.gitbook.io/~/files/v0/b/gitbook-x-prod.appspot.com/o/spaces%2FVy65sax6FVoNo2UTlJ0x%2Fuploads%2FuQyMKdy8AtWozV90iYx8%2Fimage.png?alt=media&amp;token=95b8dab3-7ec9-48ee-a394-9329517c672d" alt="Internal Linked style"></td><td>A cell that links to an existing calculation. If you enter a Variable into the Layout multiple times, only the first instance will perform the calculation - subsequent instances of the Variable will link to the first one.</td></tr><tr><td><img src="https://2847533834-files.gitbook.io/~/files/v0/b/gitbook-x-prod.appspot.com/o/spaces%2FVy65sax6FVoNo2UTlJ0x%2Fuploads%2FBPvvylpNMSZa3RTRU7Jm%2Fimage.png?alt=media&amp;token=71669bf7-7028-4805-9f89-6129f430d8a1" alt="Do Not Edit style"></td><td>Cells that should never be changed.</td></tr><tr><td><img src="https://2847533834-files.gitbook.io/~/files/v0/b/gitbook-x-prod.appspot.com/o/spaces%2FVy65sax6FVoNo2UTlJ0x%2Fuploads%2FR84gG74IZ1M3RxcovsPI%2Fimage.png?alt=media&amp;token=f2b4e61c-7ff7-4bca-a5ba-9ae3a43aa250" alt="Error style" data-size="original"></td><td>Indicates a potential problem in generating the spreadsheet (e.g. linking to a Variable which has not been added to the Layout).</td></tr></tbody></table>

### Calculation formatting

Models gives users clear indications of how Calculation cells can be interpreted by using separator lines, as shown below. These separator lines show how, if you were building your Model directly in Excel, you could copy/paste a formula vs. where a formula needs to be manually changed.

In the example below:

1. **Time separator**: Indicates that a formula cannot be copy/pasted across this line. In this example, the formula references a previous period, so the first period uses a different formula to deal with this case. Time separators are also placed between different [**Time Segments**](/variables/time-segments).
2. **Dimension separator**: Indicates that a formula cannot be copy/pasted across this line. In this example, the `Churned members` Variable has two Dimensions, but references `Churn rate` which has a single Dimension. This means that the formula can only be copied across the first three rows, and then must be manually changed for the fourth row onwards.
3. **Summary separator**: Indicates the summary line of the Variable

<figure><img src="https://2847533834-files.gitbook.io/~/files/v0/b/gitbook-x-prod.appspot.com/o/spaces%2FVy65sax6FVoNo2UTlJ0x%2Fuploads%2ForPOWtBKU3n20xUpLs1T%2Fimage.png?alt=media&amp;token=9aefe5b4-44b1-4878-95ce-8bad8e379608" alt=""><figcaption><p>Calculation separator lines</p></figcaption></figure>

{% hint style="info" %}
While Models controls most of the layout of your spreadsheet, you can tailor some colors and cell formatting to your requirements - read on to find out more.
{% endhint %}


# Excel Themes and Styles

How to style your Excel outputs

## Themes

In Models, you can set a specific theme for any Model, or use a default theme, set in the [**Application Settings**](/models/home-tab/application-settings).

You can create as many themes as you like. Each **Theme** comprises:

1. An [**Excel Theme File**](#excel-theme-files)**,** which sets the color scheme for your Model
2. A set of [**Styles**](#styles), which instructs Models how it should format different types of cell in your Excel output&#x20;

You can create and edit **Themes** in the Themes applet, accessible from the [**Navigation Bar**](/using-taglo-software/the-taglo-interface/navigating-in-models), or from any Themes picker.

### Default and Model Themes

You can set the Theme for a Model in two ways:

1. Use the Default theme for all Models
2. Set a specific theme for an individual Model

Default themes are set by navigating to **Edit > Edit settings**, and selecting/creating a Theme in the **Default Theme** page of the wizard. This Theme will automatically be applied to any new Models.

To set a **specific theme** for a Model, in the [**Model Editor**](/models/model-editor), open the Model settings bar, and click **Edit** in the [**Model settings**](/models/model-editor#model-settings-bar) section. This will open a wizard in which you can set the Theme to be used in the Model.

### Excel Theme Files

To generate spreadsheets, Models must have access to an Excel color scheme file (.xml extension). Models comes installed with a default Theme File, but you can change to a color scheme of your choosing at any time.

When you create a new **Theme File** item, you will be asked to select a .xml color scheme file from your computer, which Models will copy to your data folder locally.

#### Creating a .xml color scheme

There are several ways of creating one of these files, including from within Excel, Word or PowerPoint. Below are the steps to create a scheme from Excel (modern versions).

#### Exporting a color scheme from Excel

* Open any spreadsheet in Excel
* Navigate to **Page Layout > Colors**

![](https://2847533834-files.gitbook.io/~/files/v0/b/gitbook-x-prod.appspot.com/o/spaces%2FVy65sax6FVoNo2UTlJ0x%2Fuploads%2FHHTlpXRQJPEbPbYJSnKf%2Fimage.png?alt=media\&token=77a4062d-e89c-42a7-bcf3-119727509b5e)

* Click on **Customize Colors...** at bottom of list

![](https://2847533834-files.gitbook.io/~/files/v0/b/gitbook-x-prod.appspot.com/o/spaces%2FVy65sax6FVoNo2UTlJ0x%2Fuploads%2FVjqv5F6irdxt0H3k1I1N%2Fimage.png?alt=media\&token=377569c2-223d-4082-acbf-6a339096e0a0)

* Use the dialog box to edit your color scheme, enter a **Name** for it, and click **Save**

<img src="https://2847533834-files.gitbook.io/~/files/v0/b/gitbook-x-prod.appspot.com/o/spaces%2FVy65sax6FVoNo2UTlJ0x%2Fuploads%2FMB37RlthkuwhDGOJflva%2Fimage.png?alt=media&amp;token=e0f61bd0-7b80-42f0-aa1c-5eb0855e7d05" alt="" data-size="original">

* Your color scheme will be saved as ***\[Name].xml*** in *C:\Users\\**\[Your User Name]**\AppData\Roaming\Microsoft\Templates\Document Themes\Theme Colors*

![](https://2847533834-files.gitbook.io/~/files/v0/b/gitbook-x-prod.appspot.com/o/spaces%2FVy65sax6FVoNo2UTlJ0x%2Fuploads%2FOMrCglMOED1Ws0hpXCCY%2Fimage.png?alt=media\&token=455ac49c-c8fc-4184-b4e7-123a841ce9b6)

### Styles

Styles allow you to select formatting options for certain types of cell in the Excel output that Models produces, such as headings, input cells and calculation cells.

The **Themes** wizard shows you how each type of cell is currently formatted, and allows you to choose a color and font style.


# Line Formatting

How to change line formatting

## Editing line formatting

After selecting one or many line items in the sheet preview, you can edit the format of the selected lines in two ways:

1. By clicking on any of the formatting controls as shown in the screenshot below. Available controls are:
   1. Bold
   2. Italic
   3. Border Above / Border Below / Double Border Below
   4. Add space above
   5. Add space below
2. Clicking on the **Edit line item settings** button.

<figure><img src="https://2847533834-files.gitbook.io/~/files/v0/b/gitbook-x-prod.appspot.com/o/spaces%2FVy65sax6FVoNo2UTlJ0x%2Fuploads%2FY4hL6y77UbHXbRAvAxdm%2Fimage.png?alt=media&amp;token=0473c854-0fc0-46bf-a40d-5a90f2c6c315" alt="Screenshot showing the &#x22;Edit settings&#x22; buttons on the Sheet preview"><figcaption><p><strong>Edit line item settings</strong> button</p></figcaption></figure>


# Data Tables

How to create Excel Data Tables

## Overview

Unlike Models, Excel will only calculate one [**Case**](/cases/introduction-to-cases) of your Model at a time, and you will need to use the [**Scenario and Sensitivity**](/cases/introduction-to-cases#how-scenarios-and-sensitivities-work-in-models) controls in your spreadsheet to change Case.

However, Excel [**Data Tables**](https://support.microsoft.com/en-us/office/calculate-multiple-results-by-using-a-data-table-e95e2487-6ca6-4413-ad12-77542a5ea50b) allow you to calculate results from different sets of inputs simultaneously, and display all results in one place. While this will not show you all outputs, it can be useful for comparing specific metrics over several Scenarios and Sensitivities, as shown in the example below.

<figure><img src="https://2847533834-files.gitbook.io/~/files/v0/b/gitbook-x-prod.appspot.com/o/spaces%2FVy65sax6FVoNo2UTlJ0x%2Fuploads%2F0AkrwasDNFI64Qx2uBRs%2Fimage.png?alt=media&amp;token=40c2e815-ee41-492e-a344-fc021e64b95f" alt=""><figcaption><p>A <strong>Data Table</strong> in Excel, generated by Models</p></figcaption></figure>

{% hint style="info" %}
Due to the limitations of Excel Data Tables, which can only respond to a single input cell, when you add a Data Table to your Layout, Scenarios and Sensitivities are combined into a list of Cases that contains all combinations.

We also add a **Cases sheet** to the Layout, which contains the list of Cases. This sheet can be [**moved and hidden**](/layout/sheets#hide-sheet-in-excel) as desired.
{% endhint %}

## Creating a Data Table

To create a Data Table, simply go to the **Tables tab** of the [**Model Editor**](/models/model-editor) and add a new item. You will need to enter a name and choose which combinations of Cases to show.

{% hint style="info" %}
If you add new Scenarios and Sensitivities to the Model, these will not automatically appear in the Data Table. You will need to edit the selected Cases if you want them to be shown.
{% endhint %}

As shown in the screenshot below, once you have created the Data Table, you can edit it in the same way you [**edit a Sheet in the sheet preview**](/layout/sheets/adding-and-editing-content#adding-in-the-sheet-preview). In a Data Table, all sheet items are [**Metrics**](/metrics/metrics).

Use [**line formatting**](/layout/excel-formatting/line-formatting) and [**group spacing**](/layout/sheets/adding-and-editing-content#the-line-group-dialog) to change the appearance of your Table.

<figure><img src="https://2847533834-files.gitbook.io/~/files/v0/b/gitbook-x-prod.appspot.com/o/spaces%2FVy65sax6FVoNo2UTlJ0x%2Fuploads%2FNrcmbhSfuiG8uonUIR2R%2Fimage.png?alt=media&amp;token=7d59b267-5868-4732-a517-849ae8ae52bd" alt="Screenshot of a Data Table in models."><figcaption><p>A <strong>Data Table</strong> in Models</p></figcaption></figure>

## Adding a Data Table to the Layout

To add a Data Table to the Layout, you must perform the following steps:

1. Add the Data Table to a [**Dashboard**](/dashboards/dashboards-basics). You must place the Data Table in the main [**Panel**](/dashboards/dashboard-layout) of the Dashboard, and the Data Table should be the only item in the Dashboard.
2. Add a Dashboard [**Sheet**](/layout/sheets) containing the Dashboard to the Layout


# Excel Generation Troubleshooting

Tips on what to do when Excel generation doesn't go as expected

## Overview

If Models or Excel encounters a problem when generating Excel, you will be shown an error or warning message in Models with details of the issue.

If this message does not provide you sufficient information to fix the issue yourself, please contact us at <support@taglo.io>.

## Known issues

<table><thead><tr><th width="282">Issue</th><th>Details</th></tr></thead><tbody><tr><td>Slow Excel generation due to offline printer</td><td>In some rare cases, Windows sees an offline printer as being connected. If this printer is the default printer, this will cause a significant delay during Excel generation due to Excel attempting to access printer's available fonts during formatting.<br><br><strong>Fix:</strong> Remove offline printer from list of printers, or set a different printer to default</td></tr><tr><td>Failure due to Plug-Ins with duplicate Named Ranges or Lambdas</td><td>If a <a href="/excel-inserts-and-outputs/excel-inserts"><strong>Plug-In</strong></a> has Named Ranges or Lambdas with the same name as in the sheets generated by Models, this can cause a failure.<br><br><strong>Fix:</strong> Remove or rename conflicting Named Ranges and Lambdas</td></tr></tbody></table>

## Tips

If the generation process is causing errors, or not working as expected, you can try the following:

<table><thead><tr><th width="234">Action</th><th>Details</th></tr></thead><tbody><tr><td>Refresh Models</td><td>Press <code>F5</code> to refresh your Model. This can sometimes solve issues with Excel generation (if this is the case, we'd appreciated it if you emailed us at <a href="mailto:support@taglo.io">support@taglo.io</a> with details of any error messages received)</td></tr><tr><td>Close all Excel instances</td><td>Problems can be caused by unclosed background instances of Excel. Models should never leave any instances of Excel open, but it can happen in rare cases, and Excel itself can leave background processes running.<br><br>You can manually close background Excel processes in Windows Task Manager, or use Models to do so by navigating to <strong>Menu > Excel > Close background Excel</strong>. Make sure you close/save any work in Excel before doing so.</td></tr></tbody></table>


# Excel Inserts

How to add custom Excel content to your spreadsheets

## Overview

There may sometimes be elements of your spreadsheet that cannot be generated by [**Models**](/models/home-tab). If this is the case, you can usually achieve your desired output using Excel Inserts.

Excel Inserts are just pre-built workbooks that can contain any kind of content. They may have no links to your generated Model (e.g. a simple cover sheet), or they might interact with your Model, (e.g. complex charts designed to show a specific output, or a separate Excel model that produces some inputs into your main Model).

You can connect your Excel Inserts to your main Model in either direction, as shown below.

<figure><img src="https://2847533834-files.gitbook.io/~/files/v0/b/gitbook-x-prod.appspot.com/o/spaces%2FVy65sax6FVoNo2UTlJ0x%2Fuploads%2FWuUMYcjjvN4hiQF2UfOn%2Fimage.png?alt=media&amp;token=2624fad6-36f7-46a9-b3dc-6aecb7770ea0" alt=""><figcaption><p>Connections from Excel Insert sheets to Models-generated sheets</p></figcaption></figure>

Read more [**here about how to connect Assumption Values to Inserts**](/assumptions/assumptions-wizard/linking-to-excel-inserts), and in the next section about [**how to create Outputs**](/excel-inserts-and-outputs/excel-outputs) from generated sheets to your Inserts.

{% hint style="info" %}
We will continue to add functionality, so always check latest features before using an Excel Insert to ensure that your desired spreadsheet output cannot be achieved within Models.
{% endhint %}

## Creating and managing Excel Inserts

Create Inserts from the **XL Inserts tab** of the [**Model Editor**](/models/model-editor), or from any list of Inserts. In the Inserts dialog (shown below), you must select an existing Excel (.xlsx) file from disk, and enter a name.

<figure><img src="https://2847533834-files.gitbook.io/~/files/v0/b/gitbook-x-prod.appspot.com/o/spaces%2FVy65sax6FVoNo2UTlJ0x%2Fuploads%2Fcv4kTvKWviDZfDbhPRE5%2Fimage.png?alt=media&amp;token=b23f2906-6207-458a-a550-32f16e79eb35" alt=""><figcaption><p>Excel Inserts wizard</p></figcaption></figure>

When you create an Insert, Models creates a copy of the Excel file into your [**Taglo data directory**](/using-taglo-software/data-storage). If you want to make subsequent changes to the Excel, you will need to edit this copy. You can open  it by expanding the preview of the Insert, and clicking on the name, as shown below <mark style="color:green;">**(1)**</mark>.

<figure><img src="https://2847533834-files.gitbook.io/~/files/v0/b/gitbook-x-prod.appspot.com/o/spaces%2FVy65sax6FVoNo2UTlJ0x%2Fuploads%2FZ4vOVqMe7LMGePWZCFcd%2Fimage.png?alt=media&amp;token=501c1ecb-61bc-49c2-a116-0f888d2915ca" alt=""><figcaption><p>Opening an Excel Insert file</p></figcaption></figure>

## Adding Insert sheets to your generated Excel

To generate Excel including Insert sheets, you must add sheets to your [**Layout**](/layout/generating-excel).

In the **new Sheet wizard**, select the `Excel Insert` sheet type to be presented with the steps as shown below. Here you can select an existing or new Excel Insert <mark style="color:green;">**(1)**</mark>, and then choose a sheet from the Excel file <mark style="color:green;">**(2)**</mark>. You can then edit the sheet details in the **Setup step&#x20;**<mark style="color:green;">**(3)**</mark>, including sheet name and tab color.

<figure><img src="https://2847533834-files.gitbook.io/~/files/v0/b/gitbook-x-prod.appspot.com/o/spaces%2FVy65sax6FVoNo2UTlJ0x%2Fuploads%2FuwqsfBaCC6hLAIZVKOoX%2Fimage.png?alt=media&amp;token=c4787a26-a481-4a13-bf59-7b5d7943a9f6" alt=""><figcaption><p><strong>Sheet wizard</strong> for Excel Insert</p></figcaption></figure>

{% hint style="info" %}
If your Excel Insert has multiple sheets, you must add each one to the Layout separately. Each sheet can be independently positioned and formatted within your generated Excel.
{% endhint %}


# Excel Outputs

How to link outputs from your generated sheets to an Excel Insert

## Overview

Models allows you to link sheets from Excel Inserts to your generated Model through **Excel Outputs**.

Excel Outputs work by generating Named Ranges which can be referenced by your custom Excel Inserts. (Read more about Named Ranges in the [**Microsoft documentation here**](https://support.microsoft.com/en-us/office/define-and-use-names-in-formulas-4d0f13ac-53b7-422e-afd2-abd7ff379c64)).

There are several types of Output that Models allows you to create:

<table><thead><tr><th width="249">Output type</th><th>Details</th></tr></thead><tbody><tr><td><code>Variable values</code></td><td>The values of a Variable across all periods of the Model (including Row Summary)</td></tr><tr><td><code>Variable headings</code></td><td>The descriptions of dimensions of a Variable (including Row Summary)</td></tr><tr><td><code>Assumption</code></td><td>The used value of an Assumption</td></tr><tr><td><code>Timings</code></td><td>The periods of the Model</td></tr></tbody></table>

Examples of `Variable values`, `Variable headings`, and `Timings` are shown in the screenshot below.

<figure><img src="https://2847533834-files.gitbook.io/~/files/v0/b/gitbook-x-prod.appspot.com/o/spaces%2FVy65sax6FVoNo2UTlJ0x%2Fuploads%2FmRiMKqbXrxTiVEnKUONe%2Fimage.png?alt=media&amp;token=45a31f16-47da-4f8d-b953-72dbd6921b9b" alt=""><figcaption><p>Excel Output examples</p></figcaption></figure>

## Creating and using Excel Outputs

In the **Excel Output wizard**, shown below, you must enter a name for your output that conforms to Excel Named Range [**naming rules**](https://support.microsoft.com/en-us/office/define-and-use-names-in-formulas-4d0f13ac-53b7-422e-afd2-abd7ff379c64). Choose the type of output, and the [**Variable**](/variables/variable-basics) or [**Assumption**](/assumptions/introduction-to-assumptions) to link to.

<figure><img src="https://2847533834-files.gitbook.io/~/files/v0/b/gitbook-x-prod.appspot.com/o/spaces%2FVy65sax6FVoNo2UTlJ0x%2Fuploads%2F6w5Cwmj4ZSpnHVbknCbh%2Fimage.png?alt=media&amp;token=4c71f910-eaea-4170-a589-af8880d698f2" alt=""><figcaption><p>Excel Output wizard</p></figcaption></figure>

When your [**Excel is generated**](/layout/generating-excel), Models will add a Named Range for each of your Outputs, with the name given. You can set up your Excel Inserts to reference these Named Ranges, which will ensure that these references are correct regardless of where your Variables or Assumptions end up in your [**Layout**](/layout/generating-excel).

{% hint style="info" %}
To reference Excel Outputs in an Insert, we recommend creating your Outputs first and generating Excel. Then create your custom sheet, referencing the Named Ranges that have been created. Once you have created your custom sheets, delete all other sheets, save the custom sheets into a separate file, and turn this file into an Excel Insert.
{% endhint %}


# Number Formats

How to manage and use Number Formats

## Overview

**Number Formats** change how values are displayed to the user within the [**Models**](/models/home-tab) application, and in generated spreadsheets.

> For instance, applying the Number Format `£#,##0` to the value `1234.567` would give a displayed value of `£1,235`.

Number Formats in Models are closely related to [**custom Number Formats in Excel**](https://support.microsoft.com/en-us/office/number-format-codes-5026bbd6-04bc-48cd-bf33-80f18b4eae68). Any custom Number Format that is valid in Excel will be accepted in Models, though some aspects of the format (e.g. color), may not be displayed within Models. When generating Excel, all aspects of the custom format will be respected.

## Managing Number Formats

Number Formats are stored separately from Models, and independent of [**Namespaces**](/using-taglo-software/namespaces), meaning they are available and can be reused across all of your Models.

Models is installed with a number of inbuilt Number Formats, but you can add an unlimited number of your own, from any Number Format picker (e.g. in the [**Variable wizard**](/variables/variable-basics/variable-setup#number-format)).

## The Number Format wizard

The Number Format wizard has only one step: enter a custom format. An example result of the custom format is displayed, as shown in the screenshot below.

{% hint style="info" %}
To see all available custom formatting rules, see the Microsoft documentation [**here**](https://support.microsoft.com/en-us/office/number-format-codes-5026bbd6-04bc-48cd-bf33-80f18b4eae68).
{% endhint %}

<figure><img src="https://2847533834-files.gitbook.io/~/files/v0/b/gitbook-x-prod.appspot.com/o/spaces%2FVy65sax6FVoNo2UTlJ0x%2Fuploads%2Fm8tzJvEqVK7LlyhxqED1%2Fimage.png?alt=media&amp;token=4e077ee1-b54a-4d58-973e-48327117b53f" alt=""><figcaption><p>The Number Format dialog</p></figcaption></figure>

## Default Number Format

You can select a default Number Format for new Variables in a Model by navigating to [**Model Settings**](/models/model-editor#model-settings).


# Dashboards Basics

How to use Dashboards to visualise and test your Model

## Overview

<figure><img src="https://2847533834-files.gitbook.io/~/files/v0/b/gitbook-x-prod.appspot.com/o/spaces%2FVy65sax6FVoNo2UTlJ0x%2Fuploads%2FfqPmjek7d8gCiuXaXtLp%2Fimage.png?alt=media&amp;token=50ee0938-28f9-41aa-bbd0-11b9267c182f" alt=""><figcaption><p>Example Dashboard</p></figcaption></figure>

Dashboards provide an easy way for you to visualise your Model and understand the impact of [**Assumptions**](/assumptions/introduction-to-assumptions), [**Scenarios and Sensitivities**](/cases/introduction-to-cases).

Dashboards are created using a simple drag and drop interface giving you the power to quickly generate a new view of your Model.

{% hint style="info" %}
Metrics and Charts will show the [**currently active Case**](/cases/introduction-to-cases#how-to-change-active-scenario-and-sensitivity) by default. Charts can be configured to always show a specific Case (see [**Dashboard Charts**](/dashboards/dashboard-items) for more details).
{% endhint %}

## Editing Dashboards

Dashboard Items can be created and moved through a drag and drop interface, as demonstrated in the gif below.

<figure><img src="https://2847533834-files.gitbook.io/~/files/v0/b/gitbook-x-prod.appspot.com/o/spaces%2FVy65sax6FVoNo2UTlJ0x%2Fuploads%2F8kfDasAvoKr6FrBptc44%2FDashboard%20editing.gif?alt=media&amp;token=7a60c41c-ada6-43b2-b2ff-d5dd98b06875" alt=""><figcaption><p>Creating, moving, editing and deleting Dashboard items</p></figcaption></figure>

### Creating an Item

To create an Item, drag an icon from the control bar to the desired position in the Dashboard. A dialog will be opened allowing you to configure the item before it is added to the layout.

### Moving an Item

To move an Item, simply drag and drop it to a different position.

### Editing and Deleting Items

To edit or delete items, you must first enable editing, using the **Editing on/off** toggle on the control bar. When editing is enabled, hovering over an item will show **Edit** and **Delete** buttons.

{% hint style="info" %}
You can only edit or delete [**Panels**](/dashboards/dashboard-layout) when the **Show panels** toggle is set to **On**.
{% endhint %}

## Dashboards in Excel

You can add a Dashboard to a [**Sheet**](/layout/sheets/sheet-content#dashboards) in your [**Layout**](/layout/generating-excel), and a representation of the Dashboard will be generated for you in Excel. There are limitations to what can be produced in Excel relative to Models - these are covered in the [**Excel Dashboards**](/dashboards/excel-dashboards) page.


# Dashboard Layout

How to arrange items in a Dashboard

## The Items Panel

All Items in a Dashboard are placed in a **Panel**, which can be oriented either horizontally or vertically. Panels can contain other Panels - in this way, you can quickly create complex and flexible layouts in your Dashboards.

To view the current layout of your Panels, clock on the **Show panels** toggle in the Dashboard control bar, as shown in the screenshot below <mark style="color:green;">**(1)**</mark>. This will reveal outlines of the Panels, and show their directions <mark style="color:green;">**(2)**</mark>.

<figure><img src="https://2847533834-files.gitbook.io/~/files/v0/b/gitbook-x-prod.appspot.com/o/spaces%2FVy65sax6FVoNo2UTlJ0x%2Fuploads%2FLG1nA2O8enq59OmHGBZx%2Fimage.png?alt=media&amp;token=743ec77a-ffd3-4ae3-87cc-ff98d8ecf2c2" alt=""><figcaption><p>Panel Orientation</p></figcaption></figure>

{% hint style="info" %}
By default, all Dashboards are created with a single `horizontal` Panel. This Panel cannot be deleted, but its orientation can be changed.
{% endhint %}

## Adding Items to Panels

To add an Item to a Panel, drag a new Item from the Control bar, or an existing Item from anywhere else in the Dashboard. As shown in the screenshots below, the blue insertion indicator will tell you whether the target Panel is oriented vertically <mark style="color:green;">**(1)**</mark> or horizontally <mark style="color:green;">**(2)**</mark>.

<figure><img src="https://2847533834-files.gitbook.io/~/files/v0/b/gitbook-x-prod.appspot.com/o/spaces%2FVy65sax6FVoNo2UTlJ0x%2Fuploads%2Ft6CF5RAENwPd5ZrEYmh9%2Fimage.png?alt=media&amp;token=2d0565db-0db0-421a-9de1-8233410687ad" alt=""><figcaption><p>Dragging items into a Panel</p></figcaption></figure>

## Adding Space

You can add blank space between Items or Panels using a Spacer. To add a Spacer, drag the Spacer icon <img src="https://2847533834-files.gitbook.io/~/files/v0/b/gitbook-x-prod.appspot.com/o/spaces%2FVy65sax6FVoNo2UTlJ0x%2Fuploads%2Fi6hjM6pCfqWFIbvojZfe%2Fimage.png?alt=media&amp;token=bcdfd29a-98fc-4323-8191-43d74c3c891a" alt="" data-size="line">from the control bar, and enter a height/width as desired.


# Dashboard Items

What Items can you show in a Dashboard?

## Overview&#x20;

<table data-header-hidden><thead><tr><th width="156.33333333333331">Item</th><th width="84" align="center">Icon</th><th>Details</th></tr></thead><tbody><tr><td><strong>Panel</strong></td><td align="center"><img src="https://2847533834-files.gitbook.io/~/files/v0/b/gitbook-x-prod.appspot.com/o/spaces%2FVy65sax6FVoNo2UTlJ0x%2Fuploads%2FsaEuoGfGSHBMxiYP0TSI%2Fimage.png?alt=media&amp;token=37e6e588-53d3-48cb-9081-efbb2c561fd3" alt="" data-size="line"></td><td>Contains other Items in a horizontal or vertical layout (see <a href="/dashboards/dashboard-layout"><strong>Dashboard Layout</strong></a> for details)</td></tr><tr><td><strong>Chart</strong></td><td align="center"><img src="https://2847533834-files.gitbook.io/~/files/v0/b/gitbook-x-prod.appspot.com/o/spaces%2FVy65sax6FVoNo2UTlJ0x%2Fuploads%2FEMcsfalt4Nfp2aQaPb2j%2Fimage.png?alt=media&amp;token=a603cbbd-9e7b-43aa-ad71-60ca61b94f22" alt="" data-size="line"></td><td>Displays a <a href="/charts/introduction-to-charts"><strong>Chart</strong></a> of a Variable's values</td></tr><tr><td><strong>Metric</strong></td><td align="center"><img src="https://2847533834-files.gitbook.io/~/files/v0/b/gitbook-x-prod.appspot.com/o/spaces%2FVy65sax6FVoNo2UTlJ0x%2Fuploads%2FP1WVUqqK6tf8KEoCGL98%2Fimage.png?alt=media&amp;token=54234c22-7253-4fee-931e-4a4fd7d7f9f5" alt="" data-size="line"></td><td>Displays a <a href="/metrics/metrics"><strong>Metric</strong></a>'s name and value(s)</td></tr><tr><td><strong>Assumptions</strong></td><td align="center"><img src="https://2847533834-files.gitbook.io/~/files/v0/b/gitbook-x-prod.appspot.com/o/spaces%2FVy65sax6FVoNo2UTlJ0x%2Fuploads%2FE7gX1kGf0YSiECEenRuB%2Fimage.png?alt=media&amp;token=04086537-e7da-4c04-9bb1-598628abf180" alt="" data-size="line"></td><td>Display a table of <a href="/assumptions/introduction-to-assumptions"><strong>Assumptions</strong></a> in which you can edit <a href="/cases/managing-scenarios"><strong>Scenario</strong></a> and <a href="/cases/managing-sensitivities"><strong>Sensitivity</strong></a> values</td></tr><tr><td><strong>Table</strong></td><td align="center"><img src="https://2847533834-files.gitbook.io/~/files/v0/b/gitbook-x-prod.appspot.com/o/spaces%2FVy65sax6FVoNo2UTlJ0x%2Fuploads%2FpBoRFEd3QiAF39PeUicL%2Fimage.png?alt=media&amp;token=5ec67fc7-78dd-42af-9acd-50d58ed924a4" alt="" data-size="line"></td><td>Displays a <a href="/layout/data-tables"><strong>Data Table</strong></a></td></tr><tr><td><strong>Spacer</strong></td><td align="center"><img src="https://2847533834-files.gitbook.io/~/files/v0/b/gitbook-x-prod.appspot.com/o/spaces%2FVy65sax6FVoNo2UTlJ0x%2Fuploads%2FF9NEAv5CvPX4YW9eVqd4%2Fimage.png?alt=media&amp;token=cd6badd8-66ff-4283-a488-11836181082e" alt="" data-size="line"></td><td>Adds blank space between Panels or Items</td></tr></tbody></table>

## Charts

When you add a Chart to a Dashboard, you will be prompted to choose a [**Variable**](/variables/variable-basics) from which to create a Chart. By default, a Chart will be created similar to the one seen in the preview for that Variable.

Just as with preview Charts, you can configure how the Chart is displayed. This is done in the **Chart settings** step of the Chart Item dialog, as shown in the screenshot below <mark style="color:green;">**(1)**</mark>.

{% hint style="info" %}
Read about configuring Chart settings [**here**](/charts/chart-customisation)
{% endhint %}

By default, the Chart's values will reflect the Model's active Scenario and Sensitivity. You can fix values to the Scenario and Sensitivity selected in the Chart settings control by using the **Vary with active Case** toggle <mark style="color:green;">**(2)**</mark>.

The width of the Chart can be edited in the **Size** page of the dialog <mark style="color:green;">**(3)**</mark>.

<figure><img src="https://2847533834-files.gitbook.io/~/files/v0/b/gitbook-x-prod.appspot.com/o/spaces%2FVy65sax6FVoNo2UTlJ0x%2Fuploads%2FOBxy89Huqi5yznFlut2n%2Fimage.png?alt=media&amp;token=583737e5-3820-4f2e-9546-7a497f8eb26f" alt=""><figcaption><p>The Chart Item dialog</p></figcaption></figure>

## Metrics

When you add a [**Metric**](/metrics/metrics) to a Dashboard, you simply need to select a Metric to display - the Metric will be formatted automatically.

## Assumptions

When you add an Assumptions Table to a Dashboard, you will be prompted to select any Assumptions to display.

Selected Assumptions will be displayed in a table in which values can be edited as you would edit values in the [**Assumptions tab**](/assumptions/introduction-to-assumptions#the-assumptions-tab).

Assumptions can can reordered by dragging and dropping them in the table.

When adding an Assumptions table, the wizard contains a page of settings (as shown below), allowing you to show or hide various columns in the table. Switching off columns can make the table narrower and allow you to view more dashboard items simultaneously.

<figure><img src="https://2847533834-files.gitbook.io/~/files/v0/b/gitbook-x-prod.appspot.com/o/spaces%2FVy65sax6FVoNo2UTlJ0x%2Fuploads%2FzFXxyz9Hll1HH1tDJ59y%2Fimage.png?alt=media&amp;token=09d34653-4d80-43a0-a52a-4b56a61f7b50" alt="Screenshot showing options for showing or hiding columns in a Dashboard assumptions table" width="563"><figcaption><p>Assumptions table settings</p></figcaption></figure>

{% hint style="warning" %}
Columns that are switched off in the dashboard are only hidden within Models, but will be shown in the generated Excel.
{% endhint %}

## Data Table

When you add a Data Table to a Dashboard, you simply need to select a Data Table to display.

{% hint style="info" %}
Note, currently Data Tables are not displayed in Models, only when generating in Excel. Read more about Excel Data Tables [**here**](/layout/data-tables).
{% endhint %}


# Excel Dashboards

How to create Excel-compatible Dashboards

## Overview

Excel has certain limitations which means that not everything that can be achieved with Models Dashboards can be replicated in Excel.

For instance, in Models, you can add the same [**Assumption**](/assumptions/introduction-to-assumptions) to multiple Dashboards and edit the Assumption value in any of the Dashboards with no problems - the Assumption value will be updated everywhere. However, in Excel you can only edit an Assumption value in one place, so multiple Dashboards with the same Assumption cannot be generated correctly.

The below section details some of rules that you will need to bear in mind for Dashboards when creating an Excel [**Layout**](/layout/generating-excel).

{% hint style="info" %}
Models will show you warnings in your Layout when you break these rules.
{% endhint %}

## Rules for Excel

<table><thead><tr><th width="262">Rule</th><th>Details</th></tr></thead><tbody><tr><td>Source Item must be in Layout</td><td>For a Dashboard Chart, Metric, or Assumptions Table, all associated Variables, Metrics and Assumptions must be added to a Sheet in the Layout</td></tr><tr><td>No repeated Assumptions</td><td>No Assumption can appear in the Dashboards of a Layout more than once</td></tr><tr><td>One Assumptions Table per Dashboard</td><td>Due to potential conflicts with row/column layouts, Excel Dashboard sheets can only contain one Assumptions Table</td></tr><tr><td>Data Tables cannot be combined with other Items</td><td>To ensure the successful operation of Data Tables in Excel, Data Tables should be in Dashboards with no other items</td></tr><tr><td>Charts will not be automatically aggregated over time</td><td>If you have a Chart in a Dashboard using <a href="/charts/chart-customisation#time"><strong>Time Aggregation</strong></a>, the Chart in Excel will be shown in the default time periods of the Model. If you want a Chart with aggregated time periods in Excel, you must create a corresponding <a href="/variables/variable-basics/variable-setup#time-period"><strong>aggregated Variable</strong></a> first.</td></tr></tbody></table>


# Metrics

How to create summary Calculations from your Model

## Overview

**Metrics** are Calculations which are independent of the [**Timings**](/models/home-tab/creating-a-model/timings) of a [**Model**](/models/home-tab). Whereas a [**Variable**](/variables/variable-basics) calculates a value for each period of the Model, a Metric calculates a single value.

> For instance, a Metric might be NPV (the [**Net Present Value**](https://en.wikipedia.org/wiki/Net_present_value) of all cashflows), or the number of customers at a specific point in time.

## The Metrics wizard

Metrics can be created and edited in the Metrics wizard, the steps of which are described below.

<figure><img src="https://2847533834-files.gitbook.io/~/files/v0/b/gitbook-x-prod.appspot.com/o/spaces%2FVy65sax6FVoNo2UTlJ0x%2Fuploads%2F8otnBoQL4lCrkHiO8LIZ%2Fimage.png?alt=media&amp;token=381e2a0e-6a62-4ec9-86db-11a521959c2e" alt="Screenshots showing the two pages in the Metrics wizard"><figcaption><p>The Metrics wizard</p></figcaption></figure>

### Setup

#### Name

Choose a name for your Metric. There are no restrictions to the name, as long as it is not blank.

#### Dimensions

Optionally choose any [**Dimensions**](/dimensions/introduction-to-dimensions) to apply to the Metric. While a Metric will only produce one value across all periods of the Model, it can have values across several child items (in the example above, the Metric produces one value per `Region`).

#### Number Format

Choose a [**Number Format**](/number-formats/number-formats) for the Metric.

#### Data Type

Choose a [**Data Type**](/data-types/data-types) for the Metric. Currently the `Validation` Data Type is not supported for Metrics.

#### Tags

Choose any additional [**Tags**](/tags/introduction-to-tags) to apply to your Metric for search purposes.

### Calculation

Create a [**Calculation**](/calculations/introduction-to-calculations) for your Metric using the same [**Formula Entry Bar**](/calculations/the-calculation-page/the-formula-entry-bar) used in the Variable dialog.&#x20;

You must make sure that any Variable or Period references in a Metric Calculation [**reference specific periods**](/calculations/calculation-parts/variable-references/referencing-time) of the Model. By default, they will reference all periods of the Model (from first period to last period).


# Introduction to Charts

How to visualise your Calculations in Models

## Overview

Every [**Variable**](/variables/variable-basics) that you create in Models is automatically visualised for you in a Chart in the [**Variable preview**](/variables/variable-basics#the-variables-preview).&#x20;

<figure><img src="https://2847533834-files.gitbook.io/~/files/v0/b/gitbook-x-prod.appspot.com/o/spaces%2FVy65sax6FVoNo2UTlJ0x%2Fuploads%2FMmheFnDZkwK8WEO0uiWp%2Fimage.png?alt=media&amp;token=8950c88d-177f-45a1-899a-77dcbbab4eb1" alt=""><figcaption><p>Example of a Chart in a Variable preview</p></figcaption></figure>

Similarly, if you select multiple related [**Assumptions**](/assumptions/introduction-to-assumptions), the Assumptions preview will display a chart.

<figure><img src="https://2847533834-files.gitbook.io/~/files/v0/b/gitbook-x-prod.appspot.com/o/spaces%2FVy65sax6FVoNo2UTlJ0x%2Fuploads%2FF3wgS6ofIcsJI7hCxWdY%2Fimage.png?alt=media&amp;token=7969f620-da42-46fb-a5fb-e8957d21c598" alt=""><figcaption><p>Example of a Chart in an Assumptions preview</p></figcaption></figure>

In both of these examples, the Charts can be manipulated (in terms of type of chart, information shown, time periods etc.), allowing you to dynamically investigate your Model's inputs and outputs, but these changes will be temporary, and will be lost when you select other items.

To create permanent visualisations, you can use [**Dashboards**](/dashboards/dashboards-basics), in which you can view multiple charts in one place.

<figure><img src="https://2847533834-files.gitbook.io/~/files/v0/b/gitbook-x-prod.appspot.com/o/spaces%2FVy65sax6FVoNo2UTlJ0x%2Fuploads%2Fdeu2DryuzM2uqTXbkV4j%2Fimage.png?alt=media&amp;token=7cab2951-1970-45af-a609-54e2aa1f8999" alt=""><figcaption><p>Example of several permanent Charts in a Dashboard</p></figcaption></figure>

In either case, and anywhere else that you see a Models chart, the full range of chart customisations will be available to you, which you can read about in the next section.


# Chart Customisation

How to alter the appearance of Charts

## Chart Settings

<figure><img src="https://2847533834-files.gitbook.io/~/files/v0/b/gitbook-x-prod.appspot.com/o/spaces%2FVy65sax6FVoNo2UTlJ0x%2Fuploads%2FRkrtwayUn1Y0TDAYLWJe%2Fimage.png?alt=media&amp;token=9e52b4bc-79c2-4d8a-bb47-cb5fa41f4a15" alt="Screenshot of a chart, showing the expanded chart settings area which contains various controls" width="563"><figcaption><p>The Chart settings area</p></figcaption></figure>

Each chart has an expandable **Chart settings** area in which four types of changes can be made:

1. Chart type
2. Labels
3. Time
4. Fix Series Axis
5. Data shown

Below, we go through each of these in turn

## Chart type

<figure><img src="https://2847533834-files.gitbook.io/~/files/v0/b/gitbook-x-prod.appspot.com/o/spaces%2FVy65sax6FVoNo2UTlJ0x%2Fuploads%2FxdoVWGZ5BCcdJMgPZe9u%2Fimage.png?alt=media&amp;token=0788bdc8-58b0-4606-b809-4416d50b4127" alt=""><figcaption><p>Example Chart types</p></figcaption></figure>

Chart type can be changed by simply selecting a new option from the **Chart Type dropdown**, as shown above.

## Labels

<figure><img src="https://2847533834-files.gitbook.io/~/files/v0/b/gitbook-x-prod.appspot.com/o/spaces%2FVy65sax6FVoNo2UTlJ0x%2Fuploads%2FwmVtsufZfnCwuhOkTuXe%2Fimage.png?alt=media&amp;token=cae63fa8-250d-46ea-98dc-e28774454eba" alt=""><figcaption><p>Example Label positioning</p></figcaption></figure>

Labels can be added to Charts using the **Labels dropdown**, as shown above. Available Label options depends on the Chart type.

## Time

<figure><img src="https://2847533834-files.gitbook.io/~/files/v0/b/gitbook-x-prod.appspot.com/o/spaces%2FVy65sax6FVoNo2UTlJ0x%2Fuploads%2Fo9dSSJSoGkyqivMZBHCQ%2Fimage.png?alt=media&amp;token=3e965ce7-a127-4452-aae9-a11d3de55204" alt=""><figcaption><p>Charts aggregated over different Time Periods</p></figcaption></figure>

You can aggregate your charts over different time periods using the **Time dropdown**, as shown above.&#x20;

## Fix Series Axis

If "Fix Series Axis" is selected, the dimensions of the series axis (usually y-axis) will be set such that all scenarios/sensitivities can be shown on the chart without changing the axis. This gives a more visual experience when switching between scenarios.

If you want to look at an individual scenario in more detail, unselect "Fix Series Axis" and the series axis will then adjust to the best scale for just the selected scenario.

## Data Shown (Categories, Series and Filters)

A Models Chart can only show two dimensions at any given time. Usually one of the dimensions shown is `Time`, typically on the X-axis, meaning that the "series" of the Chart can only vary by one other dimension. This might be a [**Dimension**](/dimensions/introduction-to-dimensions) of the Variable (or Assumptions), but it could also be the [**Scenarios**](/cases/managing-scenarios) or [**Sensitivities**](/cases/managing-sensitivities) of the Model. Any dimensions that are not chosen as Chart categories or series, must be specified as a filter.

In the example below, the Variable has two Dimensions: `Region` (North, South), and `Membership tier` (Basic, Premium, Platinum). There are also two Scenarios and three Sensitivities in the Model. Here, `Time` has been chosen as the Chart's categories, and `Region` as the series <mark style="color:green;">**(Chart axes)**</mark>. This means that only one combination of `Membership tier`, `Sensitivities` and `Scenarios` can be shown at a time <mark style="color:green;">**(Chart filters)**</mark>. These are set to `Basic`, `Base`, and `Base` respectively <mark style="color:green;">**(Filter values),**</mark> but can be changed by the filter value dropdowns.

<figure><img src="https://2847533834-files.gitbook.io/~/files/v0/b/gitbook-x-prod.appspot.com/o/spaces%2FVy65sax6FVoNo2UTlJ0x%2Fuploads%2FjWtw5WdDvyVyWentnV7Z%2Fimage.png?alt=media&amp;token=15362ee6-f9f0-4027-a26b-b8b4e7d68cbe" alt=""><figcaption><p>Chart controls for choosing which data to display</p></figcaption></figure>

In the below example, we want to see information about the same Variable, but across both of its Dimensions, `Region` and `Membership tier`. This means we cannot keep `Time` as a dimension of the Chart; instead we use `Region` for categories, and `Membership tier` for series. This automatically makes `Time` a filter for our Chart, and we need to choose a specific date to show data for: in this case, we choose the last date of the Model, `March 2028`. Now we can see the difference between revenues across both region and membership tier simultaneously, at a given point in time.

<figure><img src="https://2847533834-files.gitbook.io/~/files/v0/b/gitbook-x-prod.appspot.com/o/spaces%2FVy65sax6FVoNo2UTlJ0x%2Fuploads%2FpzY9xvFgINxuanCiq9ga%2Fimage.png?alt=media&amp;token=5db71480-c5e6-4f14-b3aa-a60aebf84af9" alt=""><figcaption><p>Example of non-time-based Chart</p></figcaption></figure>


# Importing Models

How to save time and improve quality by re-using Models

## Overview

[**Models**](/models/home-tab) allows you to take an existing Model, and duplicate it inside another one. In this way you can create templates for commonly re-used sections, generating huge time-savings and improving consistency of your Models.

## Importing a Model

The process for importing a Model is straightforward: simply navigate through the menu to **Edit > Import Model**. This will open a wizard showing available Models to import. Select the Model you want to import, and it will be duplicated and inserted into your Model, including its Layout and Dashboards.

{% hint style="info" %}
Only Models within available [**Namespaces**](/using-taglo-software/namespaces) will be shown. Before importing, make sure that your Model's Namespace references the Namespace of the Model you want to import.
{% endhint %}

## Replacing Variables

When importing a Model, you will often want to connect it to the structure of your current Model. This can be done manually, by editing Calculations in the imported Model, but Models provides a shortcut for this proces&#x73;**,** the **Replace Variable** function.

In the example below, we have a Variable, `Revenues` <mark style="color:green;">**(2)**</mark>, in our current Model, which reflects the specific revenue line of the business that we are modelling. When we import the `Financial Statements` template Model, a second placeholder `Revenues` Variable <mark style="color:green;">**(1)**</mark> is added. We want to override all instances of this second `Revenues` Variable with our original. To do so, we perform the following:

* Select the new `Revenues` Variable
* Press the **Replace** button ![](https://2847533834-files.gitbook.io/~/files/v0/b/gitbook-x-prod.appspot.com/o/spaces%2FVy65sax6FVoNo2UTlJ0x%2Fuploads%2F9LT2hoWTMtyvUQubK75p%2Fimage.png?alt=media\&token=b1e2058b-5da8-4e74-9e28-6567abc8bb05)
* Select the original `Revenues` Variable, and press **Finish**

<figure><img src="https://2847533834-files.gitbook.io/~/files/v0/b/gitbook-x-prod.appspot.com/o/spaces%2FVy65sax6FVoNo2UTlJ0x%2Fuploads%2FSKwyAPiPTKgly1sgQwmq%2Fimage.png?alt=media&amp;token=471e70e6-377f-46b2-8b51-b7de70a7e9c5" alt=""><figcaption><p>Replacing a Variable</p></figcaption></figure>

All instances of the new `Revenues` Variable have now been replaced <mark style="color:green;">**(3)**</mark>, including in [**Dashboards**](/dashboards/dashboards-basics) and the [**Layout**](/layout/generating-excel). We can now remove the new `Revenues` Variable and associated [**Assumptions**](/assumptions/introduction-to-assumptions).

{% hint style="info" %}
Note that after we replace the new Variable, it appears as a top-level node in the Variable tree-view <mark style="color:green;">**(4)**</mark>, because it is no longer referenced by any other Variables. This tells us that it is safe to delete.
{% endhint %}

## Creating Template Models

You can import any Model into any other Model. However, if there are Models you want to use only as Templates, like the Financial Statements Model in the examples above, there are steps you can take to make them easier to import - we list some of these below.

### Make all Assumptions Constant

Generally a template Model will have different [**Timings**](/models/home-tab/creating-a-model/timings) from the Model you want to import it into. That means it's a good idea to use a [**Constant Unit**](/units/key-unit-concepts#constants) for any Assumptions in the template Model - this way, when you import the Model, it will be immediately fully-working, regardless of the Timings of the target Model.

This can be achieved in two ways:

* For any Assumptions Variable that is genuinely Constant (e.g. `Number of months per year`), make sure the Unit is Constant
* For any Assumptions Variable that is not Constant, but acts as a placeholder for a Variable in the target Model (e.g. `Revenues`), use a single [**Default Assumption**](/variables/default-assumptions). Default Assumptions are always of Constant Unit.

{% hint style="info" %}
It is not always possible to make all Assumptions Constant. For instance, if you had a template Model including a country's population over time, the population figures would reflect specific points in time. In this case, you will just need to add or remove Assumptions after importing to update the Variable in question to the Timings of the new Model. Time Segment warnings will help you determine where updates need to be made.
{% endhint %}

### Make the Model independent of Interval Type

A template Model may have a different [**Interval Type**](/models/home-tab/creating-a-model/timings#interval-type) from the Model you want to import it into (e.g. a template Model in `Years` imported into a Model in `Quarters`).

To ensure that a template Model will work across multiple Interval Types, you should use time conversion Variables, as shown in the example below.

Here, our template Model is in `Years`, but instead of just using the Variable `Years of depreciation/amortization` directly in our depreciation calculation, we first convert it into a time-generic Variable, `Periods of depreciation/amortization` using a conversion Variable of `Periods per year`. In our template Model, `Periods per year` has a constant value `1`, but if we import it into a Model with Interval Type `Months`, we can simply change the value of the `Periods per year` Assumption to `12` and our Model will work as intended.

<figure><img src="https://2847533834-files.gitbook.io/~/files/v0/b/gitbook-x-prod.appspot.com/o/spaces%2FVy65sax6FVoNo2UTlJ0x%2Fuploads%2Fc9TzddU5aWWzJUX4pBE4%2Fimage.png?alt=media&amp;token=2d989696-c1aa-446a-b650-c0f3d67f7e56" alt=""><figcaption><p>Using time conversion Variables to make a template Model compatible with different Interval Types</p></figcaption></figure>


# Introduction to Data

Coming soon...

This section will be completed soon. If you have any questions in the meantime, please email [**support@taglo.io**](mailto:support@taglo.io)


# Creating Data

Coming soon...

This section will be completed soon. If you have any questions in the meantime, please email [**support@taglo.io**](mailto:support@taglo.io)


# Data Sources

Coming soon...

This section will be completed soon. If you have any questions in the meantime, please email [**support@taglo.io**](mailto:support@taglo.io)